System monitoring is crucial for maintaining optimal performance and identifying potential issues before they become critical problems. While there are many commercial monitoring tools available, building your own custom solution gives you complete control over what metrics to track and how to present them.
In this comprehensive guide, we’ll walk through creating a professional-grade Windows OS metrics monitoring application using Python’s Streamlit framework. Our solution will provide real-time insights into CPU usage, memory consumption, disk utilization, network activity, and running processes—all presented in an intuitive, interactive dashboard.
Why Build Your Own Monitoring Tool?
Before diving into the implementation, let’s explore why creating a custom monitoring solution makes sense:
Advantages of Custom Monitoring
- Complete Customization: Tailor metrics and visualizations to your specific needs
- Cost-Effective: No licensing fees or subscription costs
- Learning Opportunity: Understand system internals and monitoring principles
- Integration Flexibility: Easy to extend and integrate with other tools
- Lightweight: Minimal resource overhead compared to heavy commercial solutions
When to Consider Custom Solutions
- Educational purposes or proof-of-concepts
- Specific monitoring requirements not met by existing tools
- Budget constraints preventing commercial tool adoption
- Need for deep customization and control
Technical Architecture
Our monitoring application leverages several powerful Python libraries:
Core Dependencies
- Streamlit: Modern web framework for data applications
- psutil: Cross-platform system and process utilities
- Plotly: Interactive visualization library
- Pandas: Data manipulation and analysis
Application Structure
Windows Metrics Monitor
├── System Information
├── CPU Metrics
├── Memory Metrics
├── Disk Metrics
├── Network Metrics
└── Process Monitoring
Key Features Overview
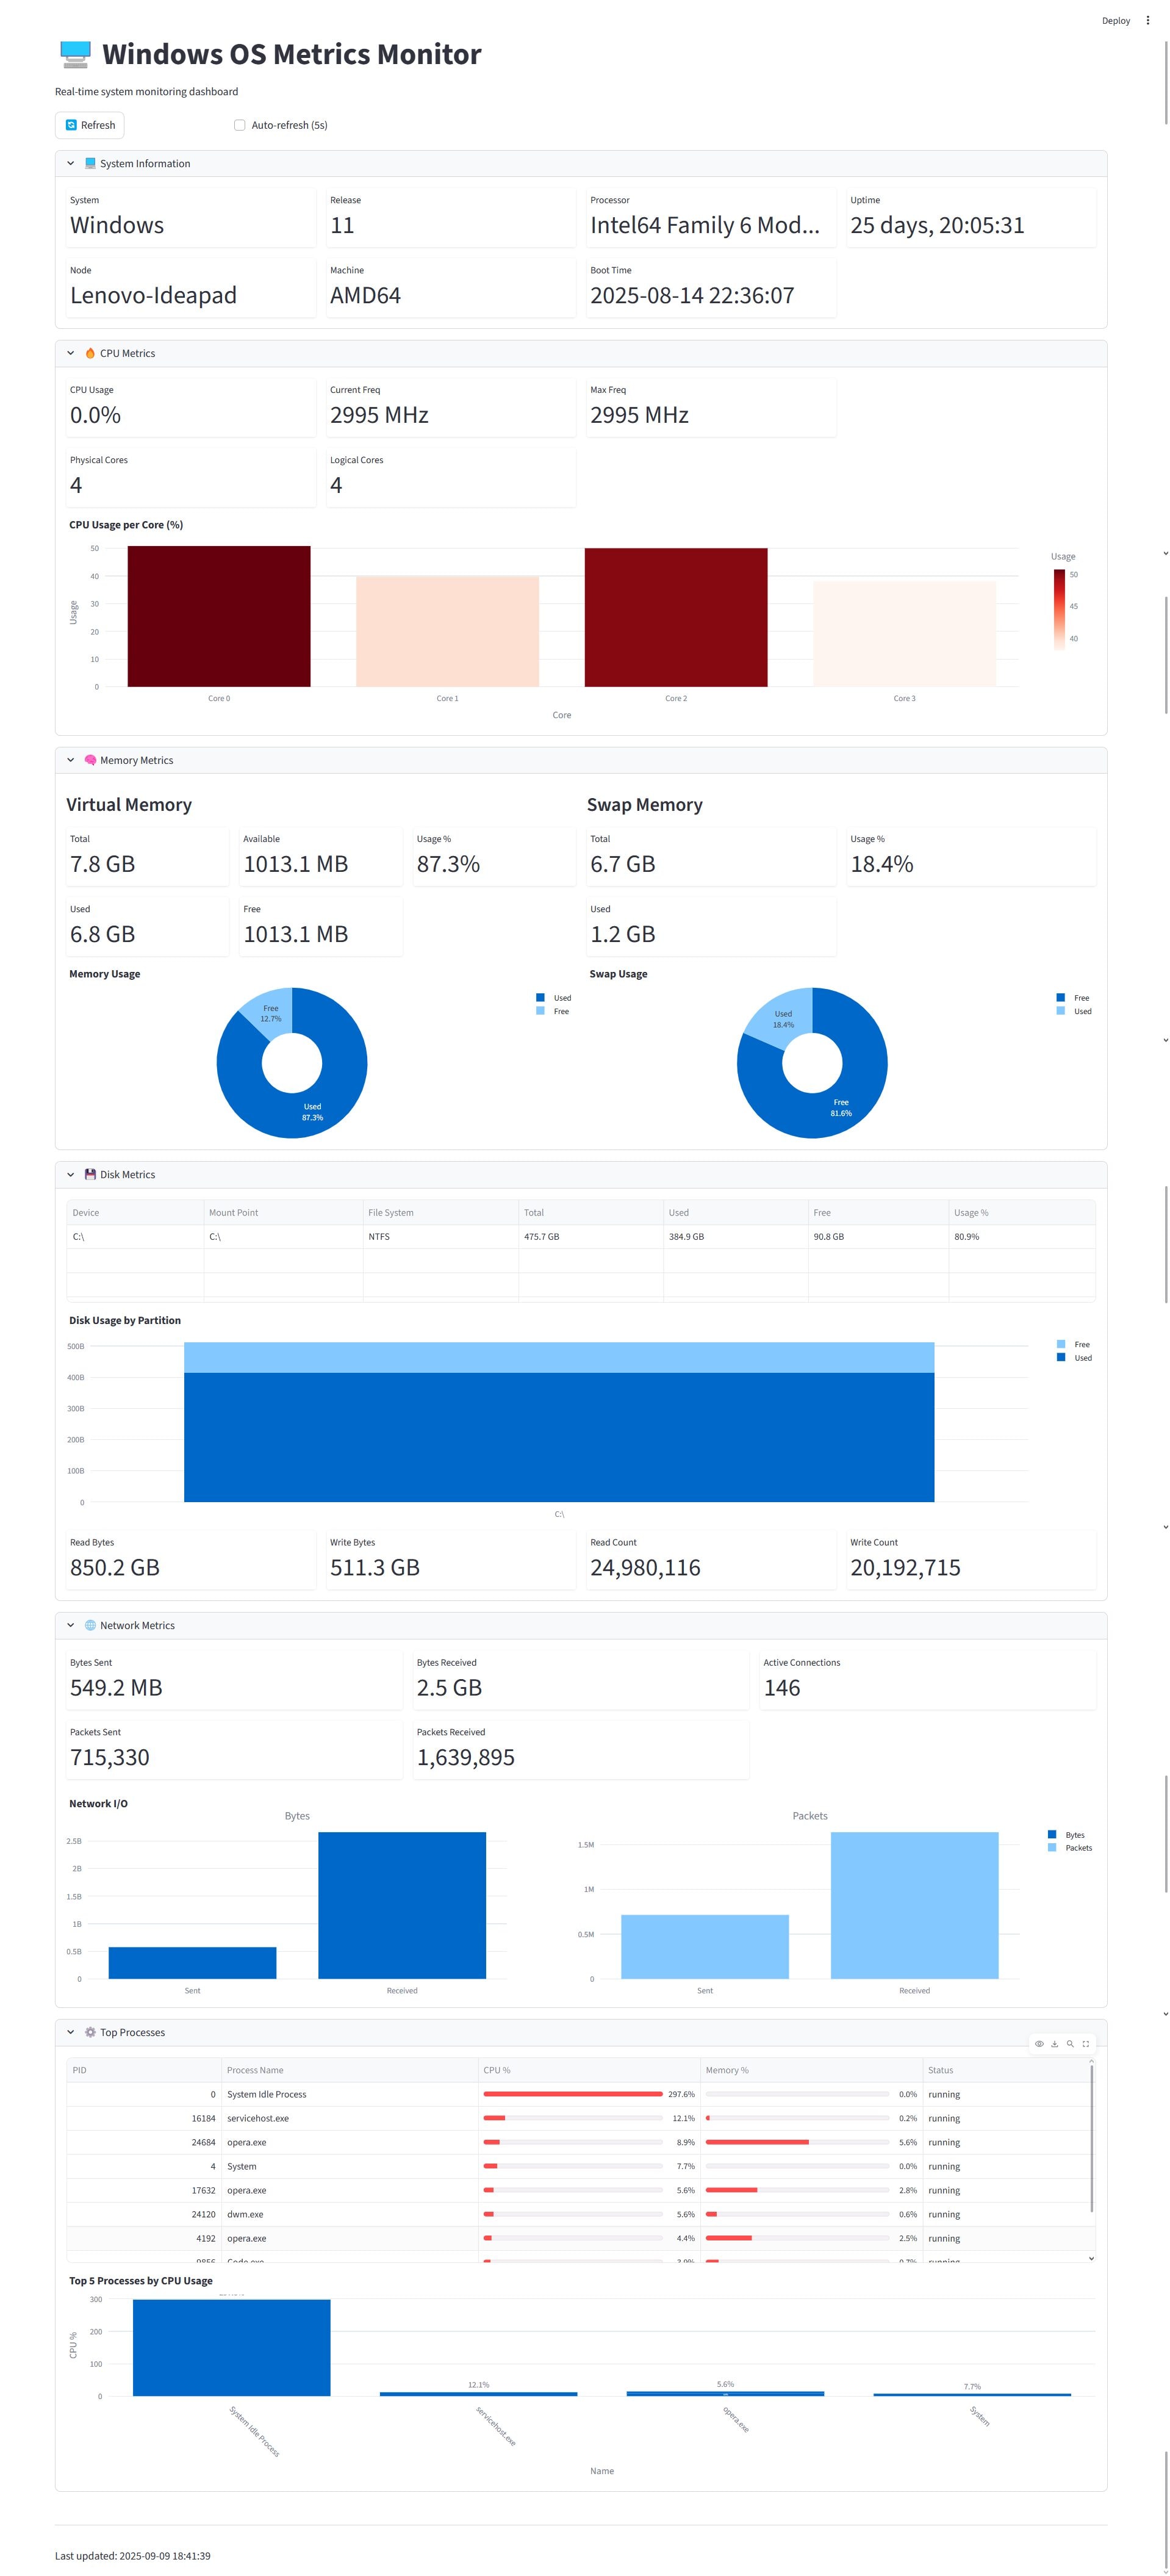
1. System Information Dashboard
Displays fundamental system details, including:
- Operating system version and architecture
- Computer name and processor information
- System boot time and current uptime
- Hardware specifications
2. Real-Time CPU Monitoring
Comprehensive CPU metrics featuring:
- Overall CPU utilization percentage
- Per-core usage breakdown with visual charts
- Current and maximum CPU frequencies
- Physical vs logical core counts
3. Memory Usage Analysis
Detailed memory monitoring, including:
- Virtual memory statistics (total, used, available, free)
- Memory usage percentage with visual indicators
- Swap memory utilization (when configured)
- Interactive donut charts for quick visual assessment
4. Disk Storage Monitoring
Complete disk analysis covering:
- Partition-level usage statistics
- File system types and mount points
- Disk I/O metrics (read/write operations)
- Visual charts showing usage across all drives
5. Network Activity Tracking
Network performance metrics, including:
- Bytes sent and received
- Packet transmission statistics
- Active network connections count
- Historical network I/O visualization
6. Process Management Interface
Advanced process monitoring featuring:
- Top processes by CPU usage
- Memory consumption per process
- Process status and identification
- Interactive tables with sorting capabilities
Implementation Deep Dive
Setting Up the Environment
First, let’s establish our development environment:
# Create a virtual environment
python -m venv monitoring_env
monitoring_env\Scripts\activate

# Install required packages
pip install streamlit psutil pandas plotly
Core System Metrics Collection
The heart of our application lies in efficient system data collection. We use Python’s psutil library to gather comprehensive system information:
import psutil
import datetime

def get_system_metrics():
    """Collect comprehensive system metrics"""
    return {
        'cpu_percent': psutil.cpu_percent(interval=1),
        'memory': psutil.virtual_memory(),
        'disk_usage': psutil.disk_usage('/'),
        'network': psutil.net_io_counters(),
        'boot_time': datetime.datetime.fromtimestamp(psutil.boot_time())
    }
Streamlit Configuration and Layout
Our application uses Streamlit’s wide layout with custom CSS for a professional appearance:
st.set_page_config(
    page_title="Windows OS Metrics Monitor",
    page_icon="🖥️",
    layout="wide",
    initial_sidebar_state="collapsed"
)
Data Caching Strategy
To ensure optimal performance, we implement strategic caching:
@st.cache_data(ttl=5)
def get_system_info():
    # Cache system info for 5 seconds
    pass

@st.cache_data(ttl=1)
def get_cpu_info():
    # Cache CPU metrics for 1 second
    pass
Different cache TTL values balance between data freshness and application responsiveness.
Interactive Visualizations
We leverage Plotly for creating engaging, interactive charts:
CPU Usage Visualization
import plotly.express as px

cpu_df = pd.DataFrame({
    'Core': [f'Core {i}' for i in range(len(cpu_percentages))],
    'Usage': cpu_percentages
})

fig = px.bar(cpu_df, x='Core', y='Usage',
             title="CPU Usage per Core (%)",
             color='Usage',
             color_continuous_scale='Reds')
Memory Usage Donut Chart
import plotly.graph_objects as go

fig = go.Figure(data=[go.Pie(
    labels=['Used', 'Free'],
    values=[memory_used, memory_free],
    hole=0.4
)])
Error Handling and Robustness
The application includes comprehensive error handling:
def get_top_processes(limit=10):
    processes = []
    for proc in psutil.process_iter(['pid', 'name', 'cpu_percent']):
        try:
            proc_info = proc.info
            processes.append(proc_info)
        except (psutil.NoSuchProcess, psutil.AccessDenied, psutil.ZombieProcess):
            # Handle process access errors gracefully
            pass
    return processes
Advanced Features
Auto-Refresh Functionality
The application includes intelligent auto-refresh capabilities:
if st.session_state.auto_refresh:
    time.sleep(5)
    st.rerun()
Users can enable 5-second automatic updates for real-time monitoring.
Responsive Design
Custom CSS ensures the interface remains clean and organized:
.metric-container {
    background: #f8f9fa;
    padding: 10px;
    border-radius: 5px;
    margin: 5px 0;
}

div[data-testid="metric-container"] {
    background-color: white;
    border: 1px solid #dee2e6;
    padding: 5px;
    border-radius: 5px;
    box-shadow: 0 1px 3px rgba(0,0,0,0.1);
}
Accordion-Based Organization
The interface uses expandable accordions to organize different metric categories:
with st.expander("💻 System Information", expanded=True):
    # System information content

with st.expander("🔥 CPU Metrics", expanded=True):
    # CPU metrics content
This approach keeps the interface clean while providing easy access to detailed information.
Performance Optimization
Efficient Data Processing
The application optimizes performance through several strategies:
- Strategic Caching: Different cache TTL values for different metric types
- Lazy Loading: Metrics are only calculated when needed
- Efficient Data Structures: Using Pandas for optimal data manipulation
- Minimal Resource Usage: Lightweight library choices
Memory Management
# Efficient process filtering
processes = [p for p in processes if p['cpu_percent'] is not None]
processes = sorted(processes, key=lambda x: x['cpu_percent'], reverse=True)[:limit]
Chart Optimization
Plotly charts are configured for optimal performance:
fig.update_layout(
    height=300,
    margin=dict(l=0, r=0, t=30, b=0)  # Minimal margins
)
Deployment Considerations
Local Deployment
For local use, simply run:
streamlit run app.py
Network Deployment
For network access, configure Streamlit to listen on all interfaces:
streamlit run app.py --server.address 0.0.0.0 --server.port 8501
Security Considerations
When deploying on networks:
- Use HTTPS for encrypted connections
- Implement authentication if needed
- Consider firewall rules and network segmentation
- Regular security updates for dependencies
Customization and Extensions
Adding New Metrics
Extend the application by adding custom metrics:
def get_custom_metrics():
    """Add custom system metrics"""
    return {
        'temperature': get_cpu_temperature(),
        'fan_speed': get_fan_speeds(),
        'power_usage': get_power_consumption()
    }
Custom Visualizations
Create specialized charts for specific use cases:
def create_temperature_gauge(temperature):
    """Create a gauge chart for temperature"""
    fig = go.Figure(go.Indicator(
        mode = "gauge+number+delta",
        value = temperature,
        domain = {'x': [0, 1], 'y': [0, 1]},
        title = {'text': "CPU Temperature"},
        gauge = {
            'axis': {'range': [None, 100]},
            'bar': {'color': "darkblue"},
            'steps': [
                {'range': [0, 50], 'color': "lightgray"},
                {'range': [50, 85], 'color': "gray"},
                {'range': [85, 100], 'color': "red"}
            ],
            'threshold': {
                'line': {'color': "red", 'width': 4},
                'thickness': 0.75,
                'value': 90
            }
        }
    ))
    return fig
Alert System Integration
Implement alerting for critical thresholds:
def check_system_health():
    """Monitor system health and generate alerts"""
    alerts = []

    cpu_usage = psutil.cpu_percent()
    if cpu_usage > 90:
        alerts.append(f"High CPU usage: {cpu_usage}%")

    memory = psutil.virtual_memory()
    if memory.percent > 90:
        alerts.append(f"High memory usage: {memory.percent}%")

    return alerts
Troubleshooting Common Issues
Permission Errors
Some system metrics may require elevated privileges:
try:
    network_connections = psutil.net_connections()
except psutil.AccessDenied:
    network_connections = []
    st.warning("Network connections require elevated privileges")
Performance Issues
If the application becomes slow:
- Increase cache TTL values
- Reduce chart update frequency
- Limit the number of displayed processes
- Optimize data processing functions
Compatibility Issues
For cross-platform compatibility:
import platform

if platform.system() == "Windows":
    # Windows-specific metrics
    pass
elif platform.system() == "Linux":
    # Linux-specific metrics
    pass
Best Practices
Code Organization
Structure your code for maintainability:
# metrics/
#   ├── __init__.py
#   ├── system.py
#   ├── cpu.py
#   ├── memory.py
#   └── network.py

# utils/
#   ├── __init__.py
#   ├── formatters.py
#   └── charts.py
Error Handling
Always implement graceful error handling:
def safe_get_metric(func, default=0):
    """Safely execute metric collection function"""
    try:
        return func()
    except Exception as e:
        st.error(f"Error collecting metric: {e}")
        return default
Testing Strategy
Implement comprehensive testing:
import pytest
import psutil

def test_cpu_metrics():
    """Test CPU metrics collection"""
    cpu_info = get_cpu_info()
    assert 'cpu_percent_total' in cpu_info
    assert 0 <= cpu_info['cpu_percent_total'] <= 100
Future Enhancements
Potential Improvements
- Historical Data Storage: Implement database integration for trend analysis
- Multi-System Monitoring: Monitor multiple machines from a single dashboard
- Advanced Analytics: Machine learning for anomaly detection
- Mobile Responsiveness: Optimize for mobile device viewing
- Export Capabilities: PDF reports and CSV data export
Integration Opportunities
- Grafana Integration: Export metrics to Grafana for advanced visualization
- Slack/Teams Alerts: Automated notifications for critical events
- API Development: REST API for programmatic access to metrics
- Cloud Integration: Deploy to AWS, Azure, or GCP
Conclusion
Building a custom Windows OS metrics monitor with Streamlit provides a powerful, flexible solution for system monitoring needs. The combination of Python’s rich ecosystem, Streamlit’s simplicity, and Plotly’s visualization capabilities creates a professional-grade monitoring tool that can be tailored to specific requirements.
This implementation demonstrates how modern Python tools can quickly create sophisticated applications that would have traditionally required extensive web development expertise. The modular architecture makes it easy to extend and customize, while the clean interface ensures usability for both technical and non-technical users.
Whether you’re a system administrator seeking better visibility into system performance, a developer learning about system monitoring, or an organization looking for a cost-effective monitoring solution, this approach provides a solid foundation that can grow with your needs.
The complete source code and detailed implementation guide provide everything needed to get started, while the extensive customization options ensure the solution can evolve to meet changing requirements. As system monitoring continues to be critical for maintaining optimal performance, having the skills and tools to build custom solutions becomes increasingly valuable.
Github link – https://github.com/sethlahaul/streamlit-windows-monitoring
