A complete guide to creating a powerful web application for mutual fund analysis and SIP planning
Introduction
In today’s investment landscape, making informed decisions about mutual funds is crucial for building wealth. With thousands of mutual fund schemes available in India, analyzing their performance, calculating potential returns, and planning systematic investments can be overwhelming for retail investors.
This comprehensive guide walks you through building a feature-rich Indian Mutual Fund Analyzer using Python and Streamlit. Our application not only analyzes mutual fund performance from inception but also includes sophisticated SIP (Systematic Investment Plan) calculators and goal-based investment planning tools.
What We’re Building
Our application includes three main components:
- Mutual Fund Search & Analysis – Real-time fund data, performance metrics, and risk analysis
- SIP Calculator – Future value calculations and target-based planning
- SIP Goal Planner – Multi-goal investment planning with visual analytics
Technical Architecture
Core Dependencies
import streamlit as st
import pandas as pd
from mftool import Mftool
import plotly.express as px
import plotly.graph_objects as go
from datetime import datetime, timedelta
Key Libraries:
- Streamlit: Web framework for rapid app development
- mftool: Python library for Indian mutual fund data from AMFI
- Plotly: Interactive visualization library
- Pandas: Data manipulation and analysis
Application Structure
The application follows a clean, modular structure:
├── Configuration & Setup
├── Data Fetching & Caching
├── Navigation System
├── Fund Analysis Module
├── SIP Calculator Module
├── Goal Planning Module
└── UI Components & Styling
Feature Deep Dive
1. Mutual Fund Analysis Engine
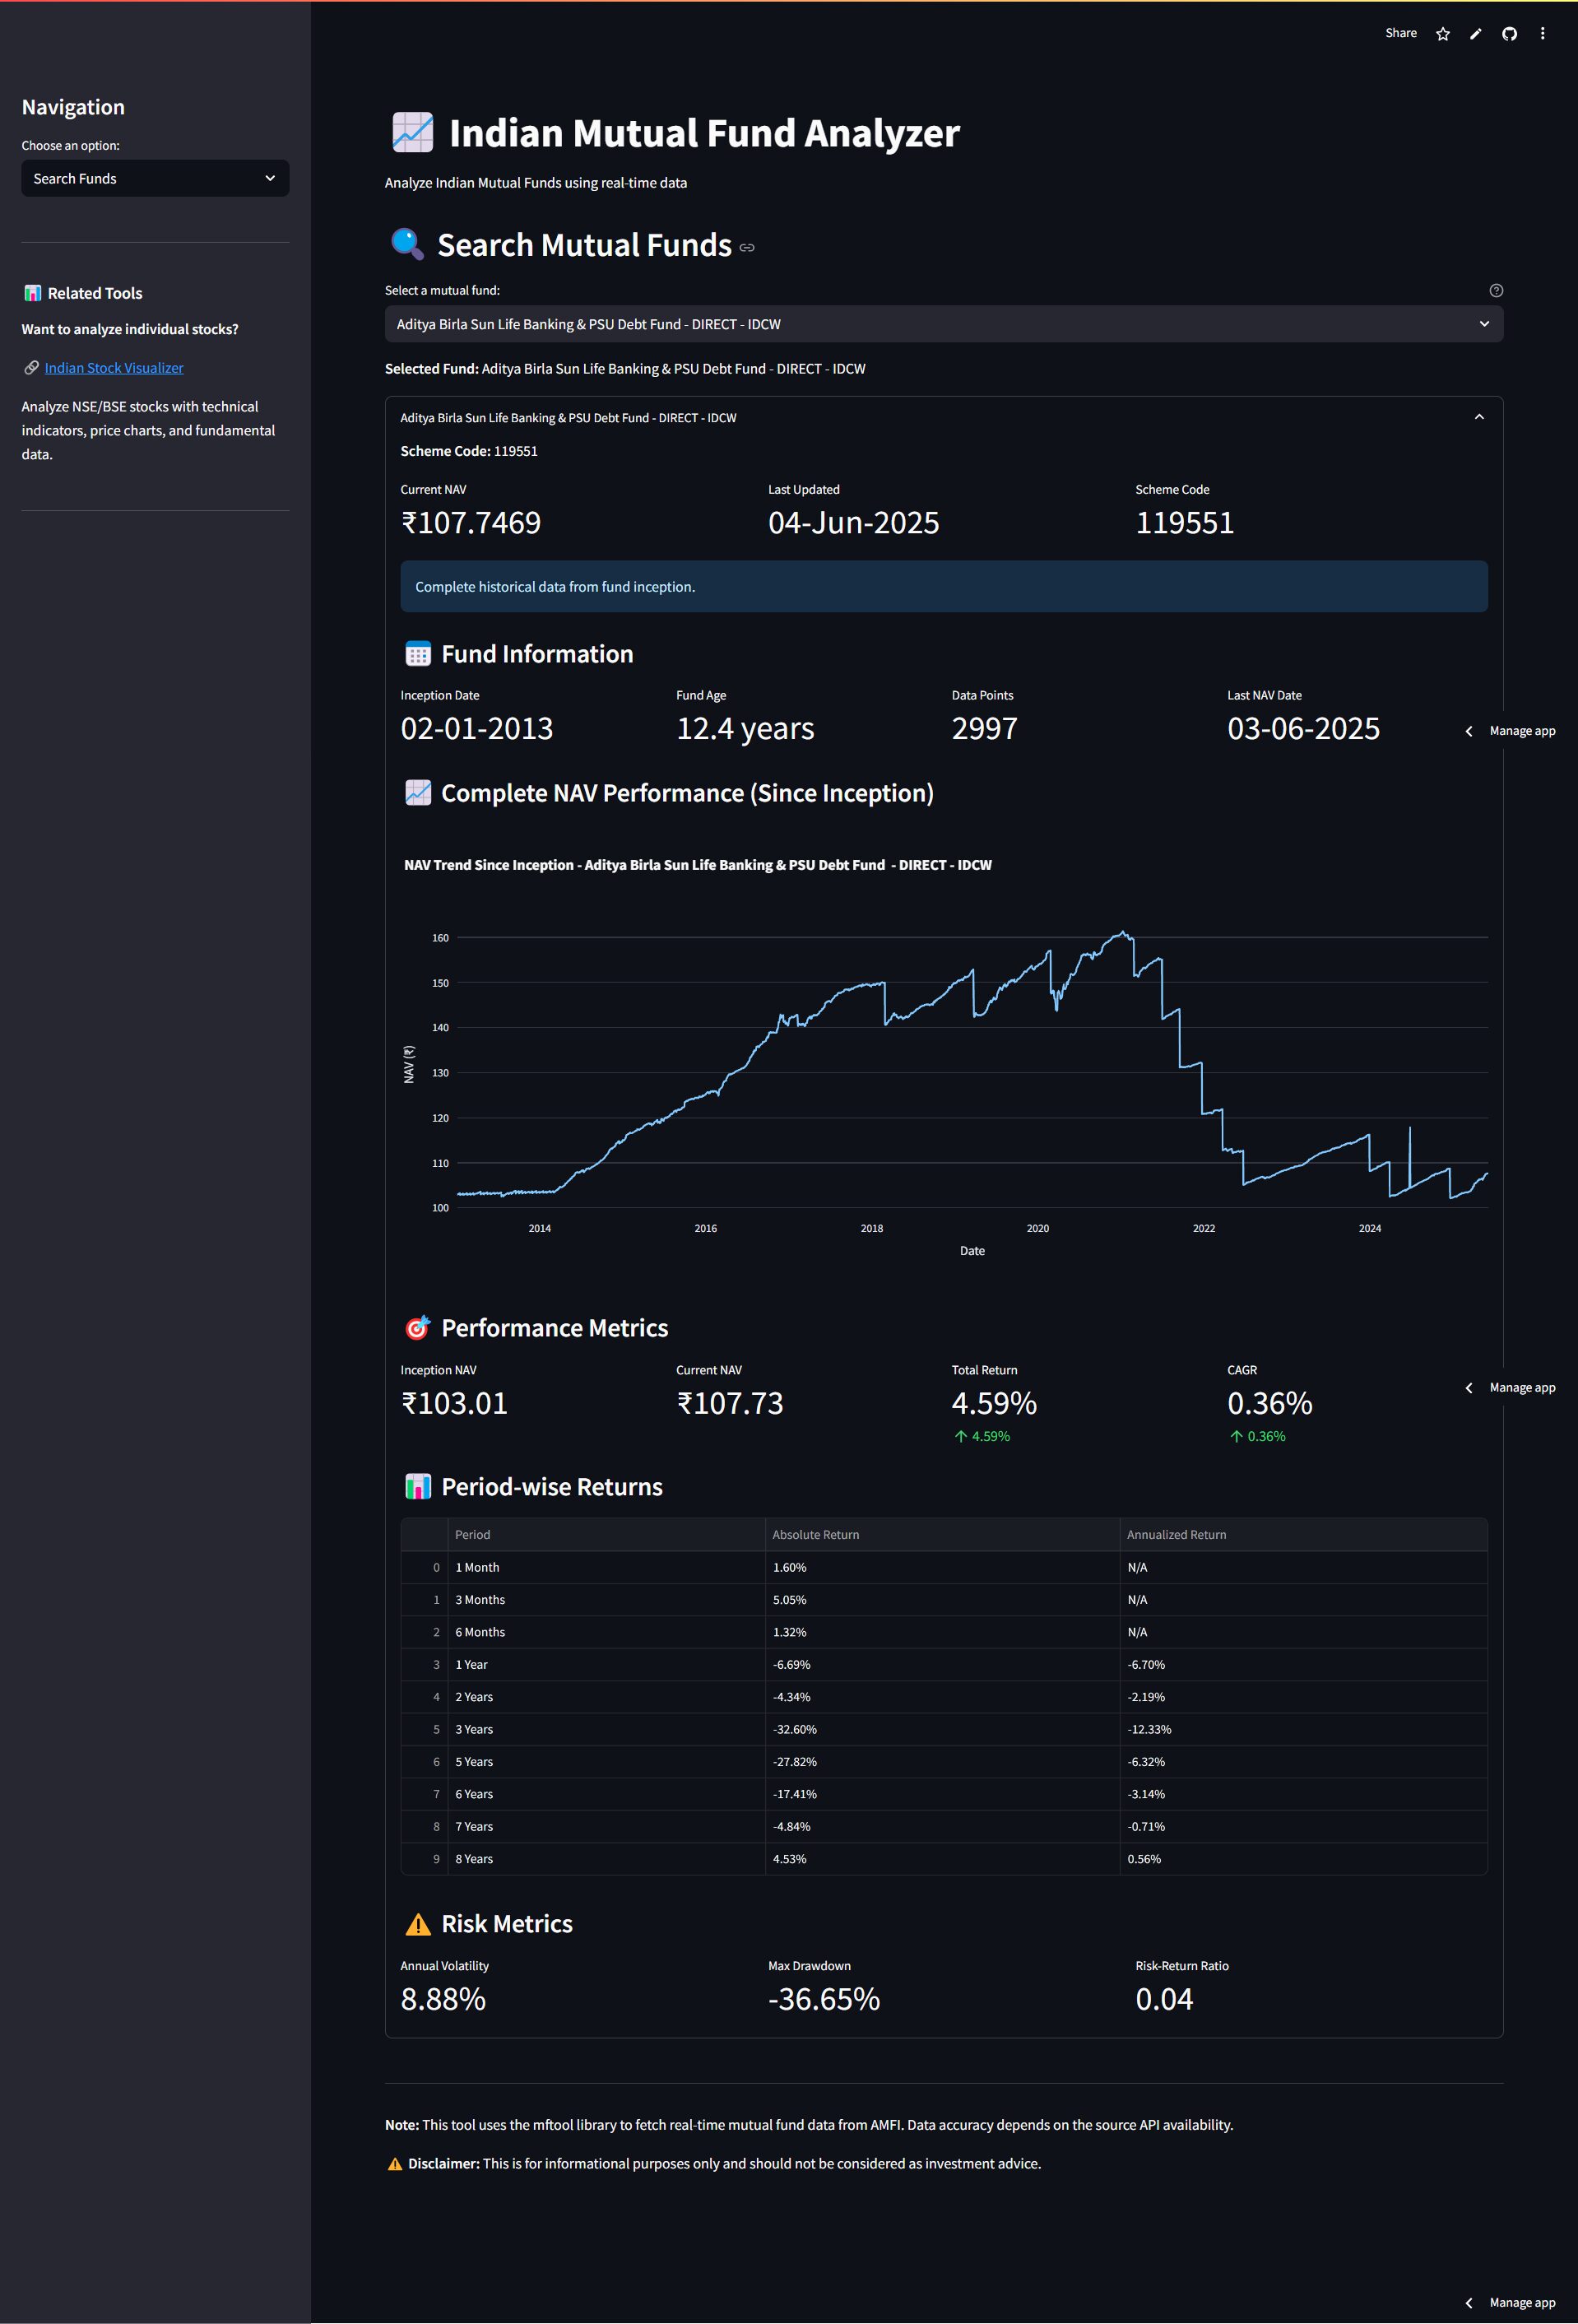
Real-time Data Integration
The heart of our application is the integration with the mftool library, which provides real-time data from AMFI (Association of Mutual Funds in India):
@st.cache_resource
def get_mf_tool():
    return Mftool()
The @st.cache_resource decorator ensures we don’t repeatedly initialize the connection, improving performance significantly.
Smart Historical Data Fetching
One of the most challenging aspects was fetching complete historical data from fund inception. Our solution uses a smart fallback mechanism:
# Try to get maximum historical data available
for years_back in range(max_years_back, 0, -1):
    try:
        start_date = end_date - timedelta(days=365 * years_back)
        historical_data = mf.get_scheme_historical_nav(
            code,
            start_date.strftime('%d-%m-%Y'),
            end_date.strftime('%d-%m-%Y')
        )
        if historical_data and 'data' in historical_data:
            break
    except:
        continue
This approach ensures we get the maximum available data while gracefully handling API limitations.
Comprehensive Performance Metrics
Our analyzer calculates multiple performance indicators:
- CAGR (Compound Annual Growth Rate):
(((current_nav / inception_nav) ** (1/fund_age_years)) - 1) * 100 - Total Returns: Absolute returns since inception
- Period-wise Returns: 1 month, 3 months, 6 months, 1 year, 2 years, 3 years, 5 years
- Risk Metrics: Annual volatility, maximum drawdown, risk-return ratio
Advanced Risk Analysis
# Annual volatility calculation
df['daily_return'] = df['nav'].pct_change()
annual_volatility = df['daily_return'].std() * (252 ** 0.5) * 100

# Maximum drawdown calculation
df['rolling_max'] = df['nav'].expanding().max()
df['drawdown'] = (df['nav'] - df['rolling_max']) / df['rolling_max']
max_drawdown = df['drawdown'].min() * 100
2. SIP Calculator System
Future Value Calculator
Our SIP calculator uses the standard future value formula for annuities:
# SIP Future Value Formula: PMT * [((1 + r)^n - 1) / r] * (1 + r)
if monthly_rate > 0:
    future_value = monthly_investment * (((1 + monthly_rate) ** total_months - 1) / monthly_rate) * (1 + monthly_rate)
Target-Based Planning
The reverse calculation helps users determine required SIP amounts:
# Required SIP Formula: Target Amount / [((1 + r)^n - 1) / r * (1 + r)]
if monthly_rate > 0:
    required_sip = target_amount / ((((1 + monthly_rate) ** total_months - 1) / monthly_rate) * (1 + monthly_rate))
Interactive Visualizations
We use Plotly for creating engaging, interactive charts:
fig = go.Figure()
fig.add_trace(go.Scatter(x=chart_df['Year'], y=chart_df['Total Investment'],
                        mode='lines+markers', name='Total Investment',
                        line=dict(color='#ff6b6b', width=3)))
fig.add_trace(go.Scatter(x=chart_df['Year'], y=chart_df['Future Value'],
                        mode='lines+markers', name='Future Value',
                        line=dict(color='#4ecdc4', width=3)))
3. Goal-Based Investment Planning
Predefined Financial Goals
The application includes common financial goals with realistic default values:
goals = {
    "Child's Education": {"amount": 2000000, "years": 15, "return": 12},
    "Child's Marriage": {"amount": 1500000, "years": 20, "return": 12},
    "Retirement Planning": {"amount": 10000000, "years": 25, "return": 12},
    "Dream Home": {"amount": 5000000, "years": 10, "return": 12},
    # ... more goals
}
Multi-Goal Optimization
Users can select multiple goals and see:
- Individual SIP requirements
- Total monthly investment needed
- Goal allocation visualization
- Timeline analysis
User Experience Design
Intuitive Navigation
The sidebar provides clear navigation between different modules:
option = st.sidebar.selectbox(
    "Choose an option:",
    ["Search Funds", "SIP Calculator", "SIP Goal Planner"]
)
Progressive Disclosure
Complex information is revealed progressively using expandable sections:
with st.expander(f"Customize {goal}", expanded=False):
    # Detailed customization options
Real-time Feedback
Loading states and progress indicators keep users informed:
with st.spinner("Fetching fund data..."):
    # API calls and data processing
Performance Optimizations
Caching Strategy
Strategic use of Streamlit’s caching mechanisms:
@st.cache_resource  # For expensive initialization
@st.cache_data      # For data processing
Efficient Data Processing
Pandas operations are optimized for performance:
df['date'] = pd.to_datetime(df['date'], format='%d-%m-%Y')
df['nav'] = pd.to_numeric(df['nav'])
df = df.sort_values('date')
Error Handling & Robustness
Comprehensive Error Handling
try:
    # API calls
    historical_data = mf.get_scheme_historical_nav(...)
    if historical_data and 'data' in historical_data:
        # Process data
    else:
        st.error("Historical data not available")
except Exception as e:
    st.error(f"Error fetching fund data: {str(e)}")
Graceful Degradation
The application continues to function even when some data is unavailable, providing fallback options and clear error messages.
Deployment Considerations
Streamlit Cloud Deployment
The application is designed for easy deployment on Streamlit Cloud:
- Requirements.txt: Include all dependencies
- Page Configuration: Set at the top of the file
- Resource Management: Proper caching and cleanup
Performance Monitoring
Key metrics to monitor:
- API response times
- Data processing speed
- User interaction patterns
- Error rates
Code Quality & Best Practices
Clean Code Principles
- Single Responsibility: Each function has a clear purpose
- DRY (Don’t Repeat Yourself): Reusable components
- Clear Naming: Descriptive variable and function names
- Documentation: Comprehensive comments and docstrings
Security Considerations
- Input Validation: All user inputs are validated
- API Rate Limiting: Handled gracefully
- Error Information: Sensitive information is not exposed
Future Enhancements
Potential Improvements
- Portfolio Analysis: Multi-fund portfolio optimization
- Comparison Tools: Side-by-side fund comparison
- Alert System: Performance-based notifications
- Export Features: PDF reports and Excel exports
- Mobile Optimization: Enhanced mobile experience
Technical Enhancements
- Database Integration: Store historical data locally
- Advanced Analytics: Machine learning predictions
- Real-time Updates: WebSocket integration
- API Development: RESTful API for data access
Conclusion
This Indian Mutual Fund Analyzer demonstrates the power of Python and Streamlit for building sophisticated financial applications. By combining real-time data fetching, comprehensive analysis, and intuitive user interfaces, we’ve created a tool that empowers investors to make informed decisions.
The application showcases several advanced concepts:
- Real-time data integration with external APIs
- Complex financial calculations with proper mathematical formulas
- Interactive visualizations for better data comprehension
- Goal-based planning with multi-objective optimization
- Responsive design principles for web applications
Key Takeaways
- User-Centric Design: Always prioritize user experience and intuitive navigation
- Data Quality: Implement robust error handling and data validation
- Performance: Use caching and optimization techniques effectively
- Scalability: Design with future enhancements in mind
- Documentation: Maintain clear, comprehensive documentation
Github – https://github.com/sethlahaul/indian-mf-monitor
Streamlit app – https://indian-mutual-fund-analyzer.streamlit.app
Whether you’re a beginner learning Python web development or an experienced developer building financial applications, this project provides valuable insights into creating production-ready applications that solve real-world problems.
The complete source code and live demo showcase how modern Python tools can democratize access to sophisticated financial analysis, making investment planning accessible to everyone.