Streamlit is a popular open-source Python library that makes creating web applications for data science and machine learning projects easy. Here’s a concise overview:
Key features:
- Simple Python-first approach – turn data scripts into shareable web apps with minimal code
- Rich library of UI components (charts, maps, inputs, etc.)
- Automatic hot reloading – see changes instantly as you code
- Built-in support for common data science libraries (Pandas, NumPy, Matplotlib, etc.)
- Easy deployment options
App features :
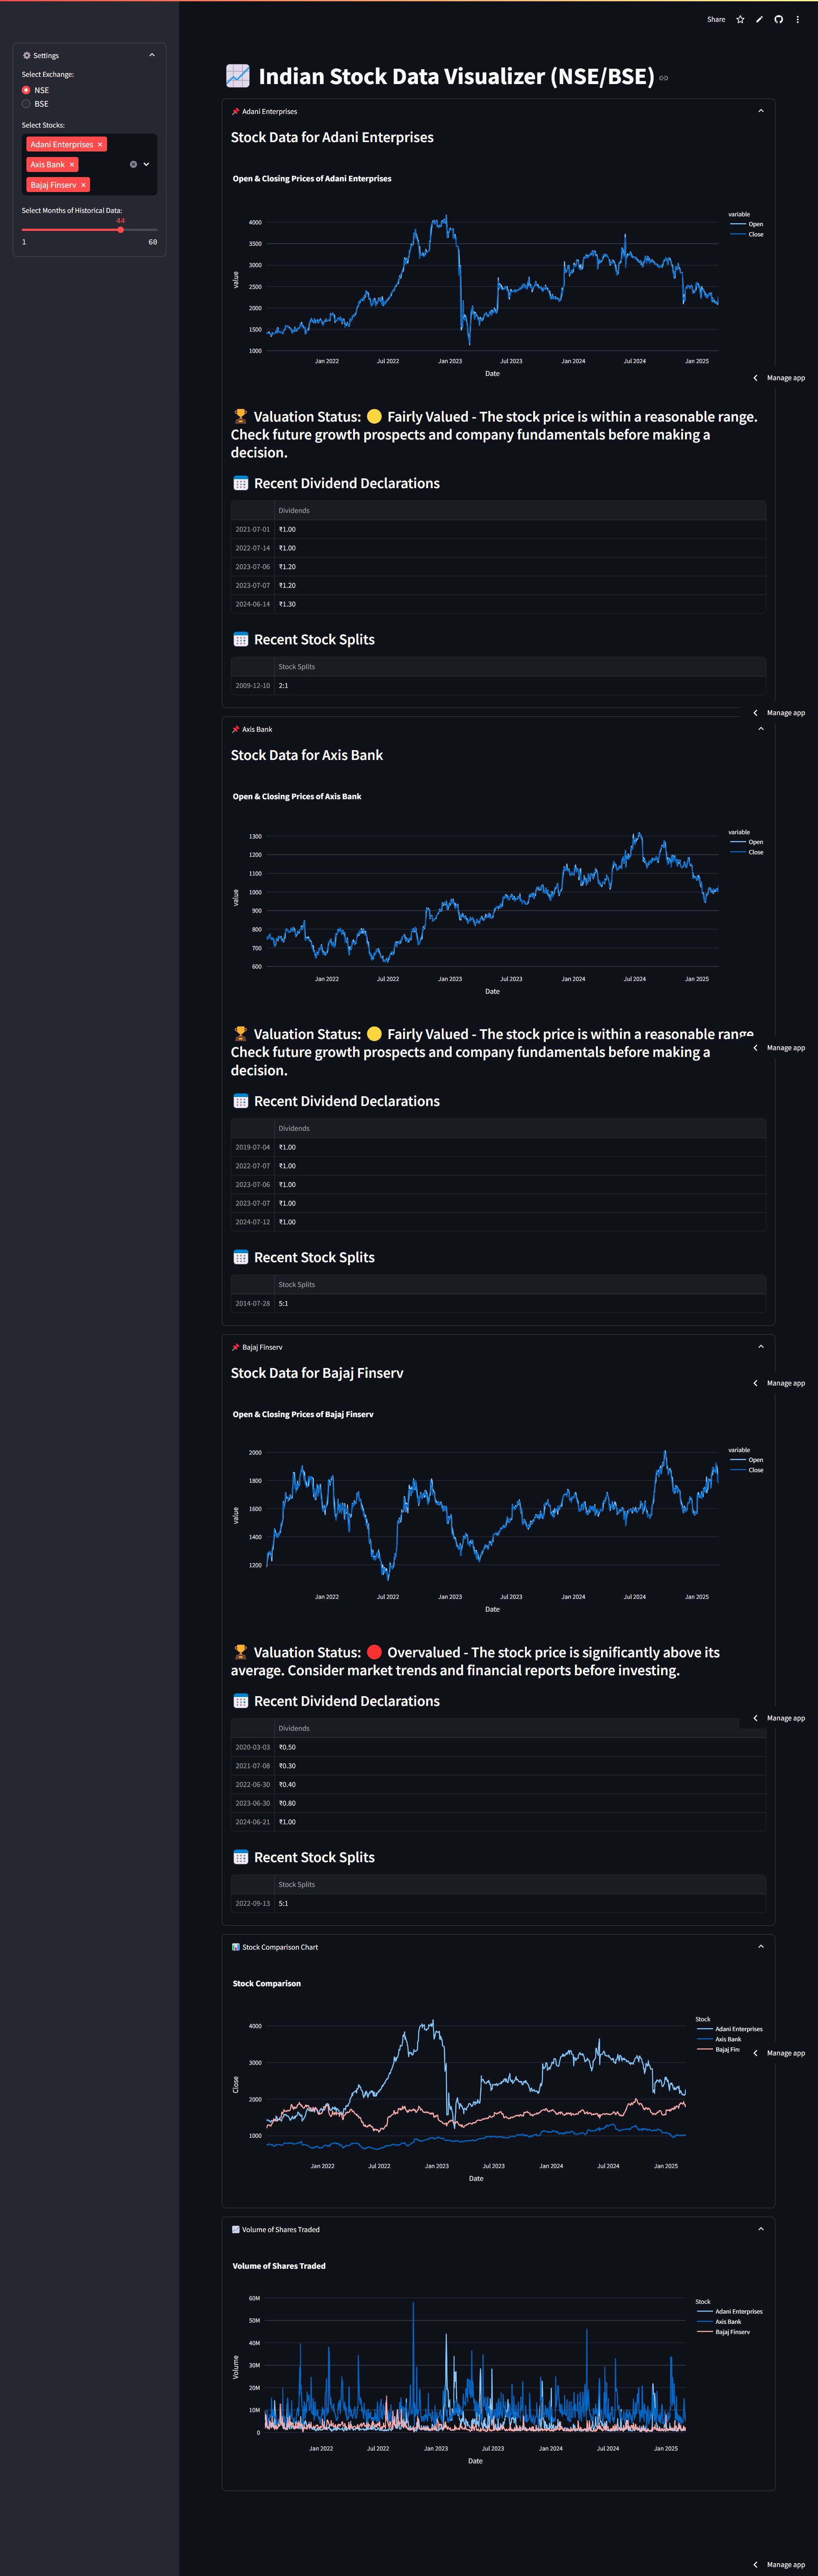
This Streamlit application provides a simple but powerful way to visualize Indian stock data from NSE and BSE. Here’s what it offers:
- Select any stock from NSE or BSE by entering the stock symbol
- Multiple timeframe options (1 month to 5 years)
- Volume data visualization
The app uses Yahoo Finance (yfinance) to fetch stock data, which works well for Indian markets by appending .NS for NSE stocks and .BO for BSE stocks to the ticker symbols.
Here’s the code for the app.
import streamlit as st
import yfinance as yf
import pandas as pd
import plotly.express as px

def get_stock_data(ticker, months=6):
    period = f"{months}mo"
    stock = yf.Ticker(ticker)
    data = stock.history(period=period, interval='1d')
    return data

def get_dividends_splits(ticker):
    stock = yf.Ticker(ticker)
    dividends = stock.dividends.tail(5)
    splits = stock.splits.tail(5)
    dividends.index = dividends.index.date
    splits.index = splits.index.date
    dividends = dividends.apply(lambda x: f"₹{x:.2f}")
    splits = splits.apply(lambda x: f"{int(x)}:1" if x > 1 else "No Split")
    return dividends, splits

def evaluate_stock(df, stock_symbol):
    if df.empty:
        return "No data available"

    recent_close = df['Close'].iloc[-1]
    avg_close = df['Close'].mean()
    std_dev = df['Close'].std()

    if recent_close > avg_close + std_dev:
        return "🔴 Overvalued - The stock price is significantly above its average. Consider market trends and financial reports before investing."
    elif recent_close < avg_close - std_dev:
        return "🟢 Undervalued - The stock price is significantly below its average. If the company has strong future prospects, this could be a good buying opportunity."
    else:
        return "🟡 Fairly Valued - The stock price is within a reasonable range. Check future growth prospects and company fundamentals before making a decision."

def main():
    st.set_page_config(page_title="Indian Stock Visualizer", layout="wide")
    st.title("📈 Indian Stock Data Visualizer (NSE/BSE)")

    with st.sidebar.expander("⚙️ Settings", expanded=False):
        exchange = st.radio("Select Exchange:", ("NSE", "BSE"))

        nifty_sensex_stocks = {
            "Reliance Industries": "RELIANCE.NS", "Tata Consultancy Services": "TCS.NS", "Infosys": "INFY.NS", "HDFC Bank": "HDFCBANK.NS",
            "ICICI Bank": "ICICIBANK.NS", "Kotak Mahindra Bank": "KOTAKBANK.NS", "Larsen & Toubro": "LT.NS", "Axis Bank": "AXISBANK.NS",
            "Hindustan Unilever": "HINDUNILVR.NS", "State Bank of India": "SBIN.NS", "Bajaj Finance": "BAJFINANCE.NS", "Bharti Airtel": "BHARTIARTL.NS",
            "Tata Steel": "TATASTEEL.NS", "ITC": "ITC.NS", "Maruti Suzuki": "MARUTI.NS", "Asian Paints": "ASIANPAINT.NS", "HCL Technologies": "HCLTECH.NS",
            "Wipro": "WIPRO.NS", "Tech Mahindra": "TECHM.NS", "UltraTech Cement": "ULTRACEMCO.NS", "Sun Pharma": "SUNPHARMA.NS", "Titan Company": "TITAN.NS",
            "Bajaj Auto": "BAJAJ-AUTO.NS", "Power Grid Corp": "POWERGRID.NS", "NTPC": "NTPC.NS", "Grasim Industries": "GRASIM.NS", "IndusInd Bank": "INDUSINDBK.NS",
            "Tata Motors": "TATAMOTORS.NS", "Nestle India": "NESTLEIND.NS", "Mahindra & Mahindra": "M&M.NS", "Dr. Reddy's Laboratories": "DRREDDY.NS",
            "JSW Steel": "JSWSTEEL.NS", "Cipla": "CIPLA.NS", "Adani Enterprises": "ADANIENT.NS", "Adani Ports": "ADANIPORTS.NS", "Eicher Motors": "EICHERMOT.NS",
            "HDFC Life Insurance": "HDFCLIFE.NS", "SBI Life Insurance": "SBILIFE.NS", "Bajaj Finserv": "BAJAJFINSV.NS", "Britannia Industries": "BRITANNIA.NS",
            "Hindalco Industries": "HINDALCO.NS", "Divi's Laboratories": "DIVISLAB.NS", "Apollo Hospitals": "APOLLOHOSP.NS", "UPL": "UPL.NS",
            "Oil & Natural Gas Corp": "ONGC.NS", "Coal India": "COALINDIA.NS", "Tata Consumer Products": "TATACONSUM.NS"
        }

        sorted_stocks = sorted(nifty_sensex_stocks.keys())
        stock_selection = st.multiselect("Select Stocks:", sorted_stocks, default=[sorted_stocks[0]])
        stock_symbols = [nifty_sensex_stocks[stock] for stock in stock_selection]
        months = st.slider("Select Months of Historical Data:", 1, 60, 6)

    all_data = []
    if stock_symbols:
        for stock_symbol, company_name in zip(stock_symbols, stock_selection):
            with st.expander(f"📌 {company_name}"):
                with st.spinner(f"Fetching data for {company_name}..."):
                    try:
                        df = get_stock_data(stock_symbol, months)
                        dividends, splits = get_dividends_splits(stock_symbol)

                        if not df.empty:
                            df['Stock'] = company_name
                            all_data.append(df)

                            st.subheader(f"Stock Data for {company_name}")
                            fig = px.line(df, x=df.index, y=['Open', 'Close'], title=f"Open & Closing Prices of {company_name}")
                            st.plotly_chart(fig, use_container_width=True)

                            valuation = evaluate_stock(df, stock_symbol)
                            st.markdown(f"### 🏆 **Valuation Status: {valuation}**", unsafe_allow_html=True)

                            if not dividends.empty:
                                st.subheader("📅 Recent Dividend Declarations")
                                st.dataframe(dividends)

                            if not splits.empty:
                                st.subheader("📅 Recent Stock Splits")
                                st.dataframe(splits)
                        else:
                            st.error(f"No data found for {company_name}. Please check the stock symbol.")
                    except Exception as e:
                        st.error(f"Error fetching data for {company_name}: {e}")

        if all_data:
            combined_df = pd.concat(all_data)
            with st.expander("📊 Stock Comparison Chart"):
                comparison_fig = px.line(combined_df, x=combined_df.index, y='Close', color='Stock', title="Stock Comparison")
                st.plotly_chart(comparison_fig, use_container_width=True)

            with st.expander("📈 Volume of Shares Traded"):
                volume_fig = px.line(combined_df, x=combined_df.index, y='Volume', color='Stock', title="Volume of Shares Traded")
                st.plotly_chart(volume_fig, use_container_width=True)

if __name__ == "__main__":
    main()
You can check out the app here – https://indian-stock-visualizer.streamlit.app