Streamlit is a popular open-source Python library that makes it easy to create web applications for data science and machine learning projects. Here’s a concise overview:
Key features:
- Simple Python-first approach – turn data scripts into shareable web apps with minimal code
- Rich library of UI components (charts, maps, inputs, etc.)
- Automatic hot reloading – see changes instantly as you code
- Built-in support for common data science libraries (Pandas, NumPy, Matplotlib, etc.)
- Easy deployment options
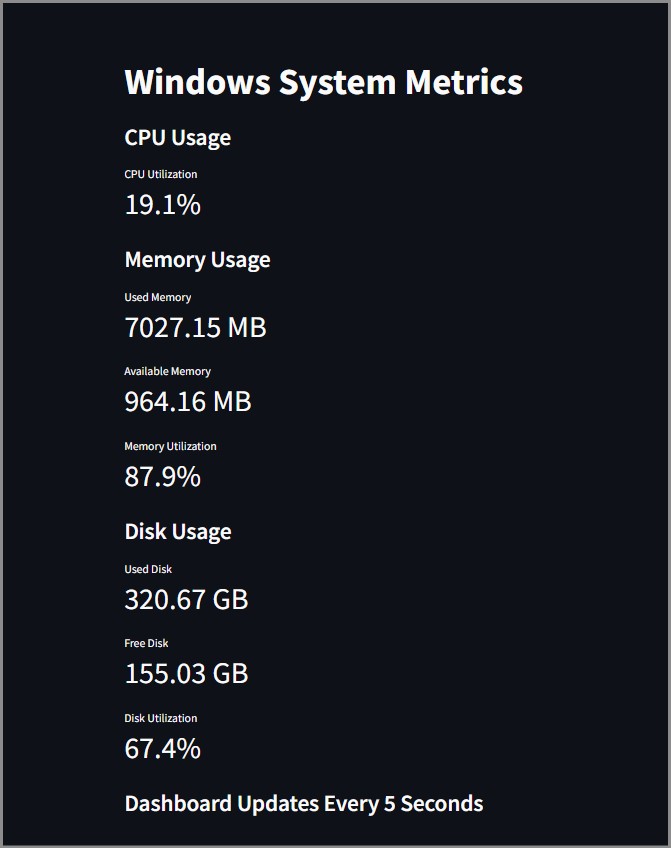
Create A Windows Monitoring Dashboard Using Streamlit
This Streamlit app uses the psutil library to fetch key system metrics like CPU, memory, and disk usage. It then displays these metrics in a clean, dashboard-style layout with Streamlit’s built-in components.
Some key features of this app:
- Displays real-time CPU, memory, and disk usage metrics
- Provides percentage utilization for each resource
- Refreshes the dashboard every 5 seconds to show updated metrics
- Uses Streamlit’s metric components for a clear, concise presentation
To use this app, you would need to have Streamlit and psutil installed. You can install them using pip:
pip install streamlit psutil
import os
import psutil
import streamlit as st
import time

def get_system_metrics():
    cpu_percent = psutil.cpu_percent(interval=1)
    memory = psutil.virtual_memory()
    disk = psutil.disk_usage('/')
    return cpu_percent, memory, disk

def main():
    st.set_page_config(page_title="Windows System Metrics")
    st.title("Windows System Metrics")

    # CPU Usage
    st.subheader("CPU Usage")
    cpu_percent, _, _ = get_system_metrics()
    st.metric("CPU Utilization", f"{cpu_percent}%")

    # Memory Usage
    st.subheader("Memory Usage")
    _, memory, _ = get_system_metrics()
    st.metric("Used Memory", f"{memory.used / (1024.0 ** 2):.2f} MB")
    st.metric("Available Memory", f"{memory.available / (1024.0 ** 2):.2f} MB")
    st.metric("Memory Utilization", f"{memory.percent}%")

    # Disk Usage
    st.subheader("Disk Usage")
    _, _, disk = get_system_metrics()
    st.metric("Used Disk", f"{disk.used / (1024.0 ** 3):.2f} GB")
    st.metric("Free Disk", f"{disk.free / (1024.0 ** 3):.2f} GB")
    st.metric("Disk Utilization", f"{disk.percent}%")

    st.subheader("Dashboard Updates Every 5 Seconds")

if __name__ == "__main__":
    main()
To run the code, use the below command.
streamlit run <filename.py>
So, that’s it for this tutorial.