Elasticsearch is a search engine based on the Lucene library. It provides a distributed, multitenant-capable full-text search engine with an HTTP web interface and schema-free JSON documents. Elasticsearch is developed in Java.
Kibana is an open source data visualization dashboard for Elasticsearch. It provides visualization capabilities on top of the content indexed on an Elasticsearch cluster. Users can create bar, line and scatter plots, or pie charts and maps on top of large volumes of data.
#1. Install ElasticSearch on Ubuntu
The first thing that you need to do is install ElasticSearch since Kibana works on top of it.
Since Ubuntu is Debian based, you will need to install it from the .deb package or using apt. You can find the steps here.
Import the public key :
First thing that you need to do is import the public key which Elastic uses to sign all their packages.
wget -qO - https://artifacts.elastic.co/GPG-KEY-elasticsearch | sudo apt-key add
Use the below command to install the package.
sudo apt-get update && sudo apt-get install elasticsearch
Once installed, you can start the service.
sudo -i service elasticsearch start
sudo -i service elasticsearch stop
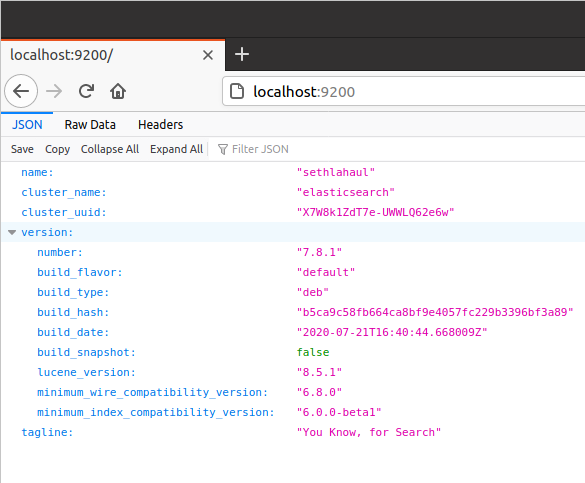
By default, ElasticSearch runs port 9200. If the service starts correctly, you should see something like below on your browser.
#2. Install Kibana on Ubuntu
You can find all the Kibana installers on this page.
If you’re looking to install Kibana using the terminal, you can follow the steps here.
Since you have already downloaded the public key while installing ElasticSearch, it need not be repeated.
Install package using apt :
Next, run the below commands to download and install Kibana.
sudo apt-get install apt-transport-https (not required if you installed this in the previous step)
echo "deb https://artifacts.elastic.co/packages/7.x/apt stable main" | sudo tee -a /etc/apt/sources.list.d/elastic-7.x.list
sudo apt-get update && sudo apt-get install kibana
Once Kibana has been installed, go to /etc/kibana/kibana.yml. Make sure to uncomment the below 3 lines.
# Kibana is served by a back end server. This setting specifies the port to use.
server.port: 5601

# Specifies the address to which the Kibana server will bind. IP addresses and host names are both valid values.
# The default is 'localhost', which usually means remote machines will not be able to connect.
# To allow connections from remote users, set this parameter to a non-loopback address.
server.host: "localhost"

# The URLs of the Elasticsearch instances to use for all your queries.
elasticsearch.hosts: ["http://localhost:9200"]
Use the below commands to start and stop the Kibana service.
sudo -i service kibana start
sudo -i service kibana stop
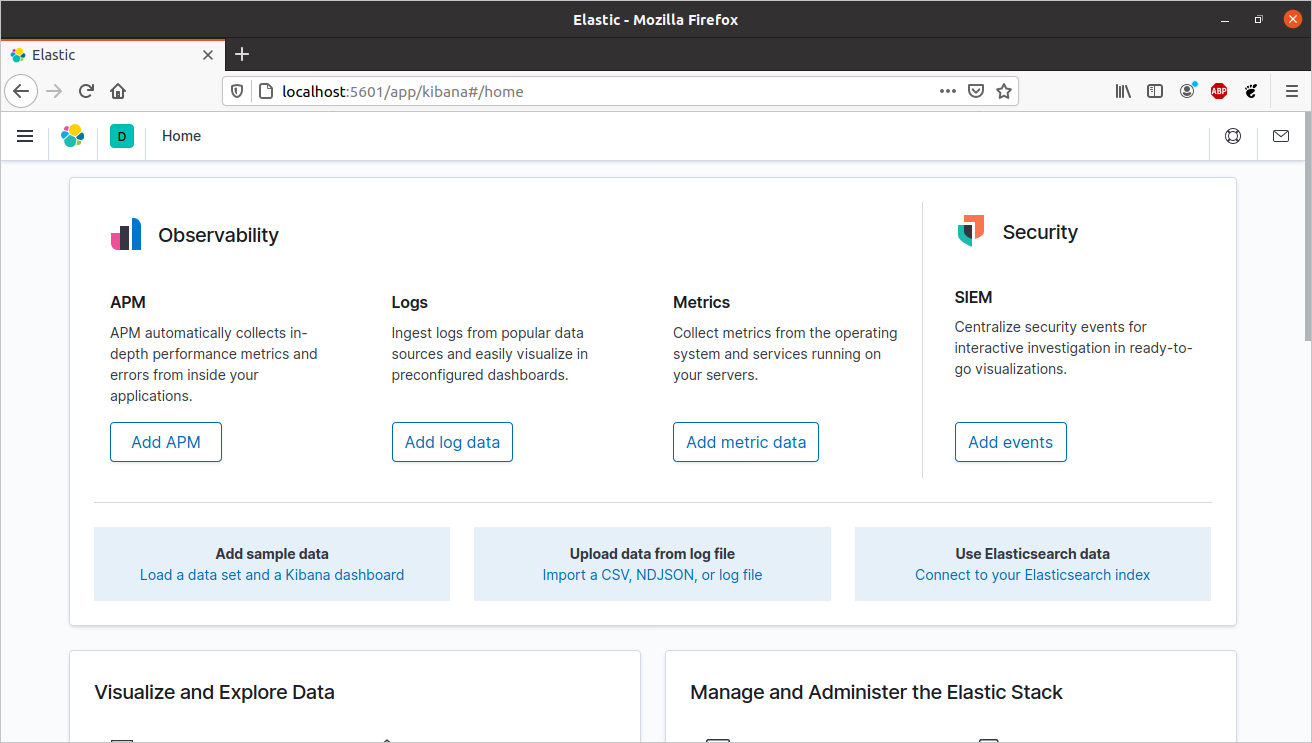
By default, Kibana runs on port 5601. If it starts correctly, you should see something like below on your browser.
You can now use Kibana to configure all kinds of visualization dashboard.