Apache Superset is fast, lightweight, intuitive, and loaded with options that make it easy for users of all skill sets to explore and visualize their data, from simple line charts to highly detailed geospatial charts.
Apache Superset can connect to any SQL based datasource through SQLAlchemy, including modern cloud native databases and engines at petabyte scale.
Superset ships with a wide array of beautiful visualizations. The visualization plug-in architecture makes it easy to build custom visualizations that drop directly into Superset.
1. Getting started with Apache Superset
If you’re just looking to test out Apache Superset, easiest way to get started is to use the Docker image. You can pull the docker image using the below command.
$ docker pull apache/superset
To run the image, use the below command.
$ docker run -d -p 8080:8088 --name superset apache/superset
To confirm if the docker image is running, use the below command.
$ docker ps -a
CONTAINER ID   IMAGE             COMMAND                  CREATED          STATUS                    PORTS                                       NAMES
50eaf142de04   apache/superset   "/usr/bin/docker-ent…"   39 seconds ago   Up 35 seconds (healthy)   0.0.0.0:8080->8088/tcp, :::8080->8088/tcp   superset
You can now open the Superset login page using http://localhost:8080.

2. Configure Apache Superset
Before you can login to Apache Superset, you need to set the login username and password. Use the below command.
$ docker exec -it superset superset fab create-admin \
               --username admin \
               --firstname Superset \
               --lastname Admin \
               --email [email protected] \
               --password admin
In the next step, you can upgrade DB.
$ docker exec -it superset superset db upgrade
Once DB is upgraded, you will see a page like below.

If you don’t have any data of your ow, you can load the examples to check how Superset works.
$ docker exec -it superset superset load_examples
Once examples are loaded, setup the roles using the below command.
$ docker exec -it superset superset init
Once done, logout and login again.
3. Visualize data
Once you login, you will be able to explore the data. There are multiple ways to visualize data in Superset.
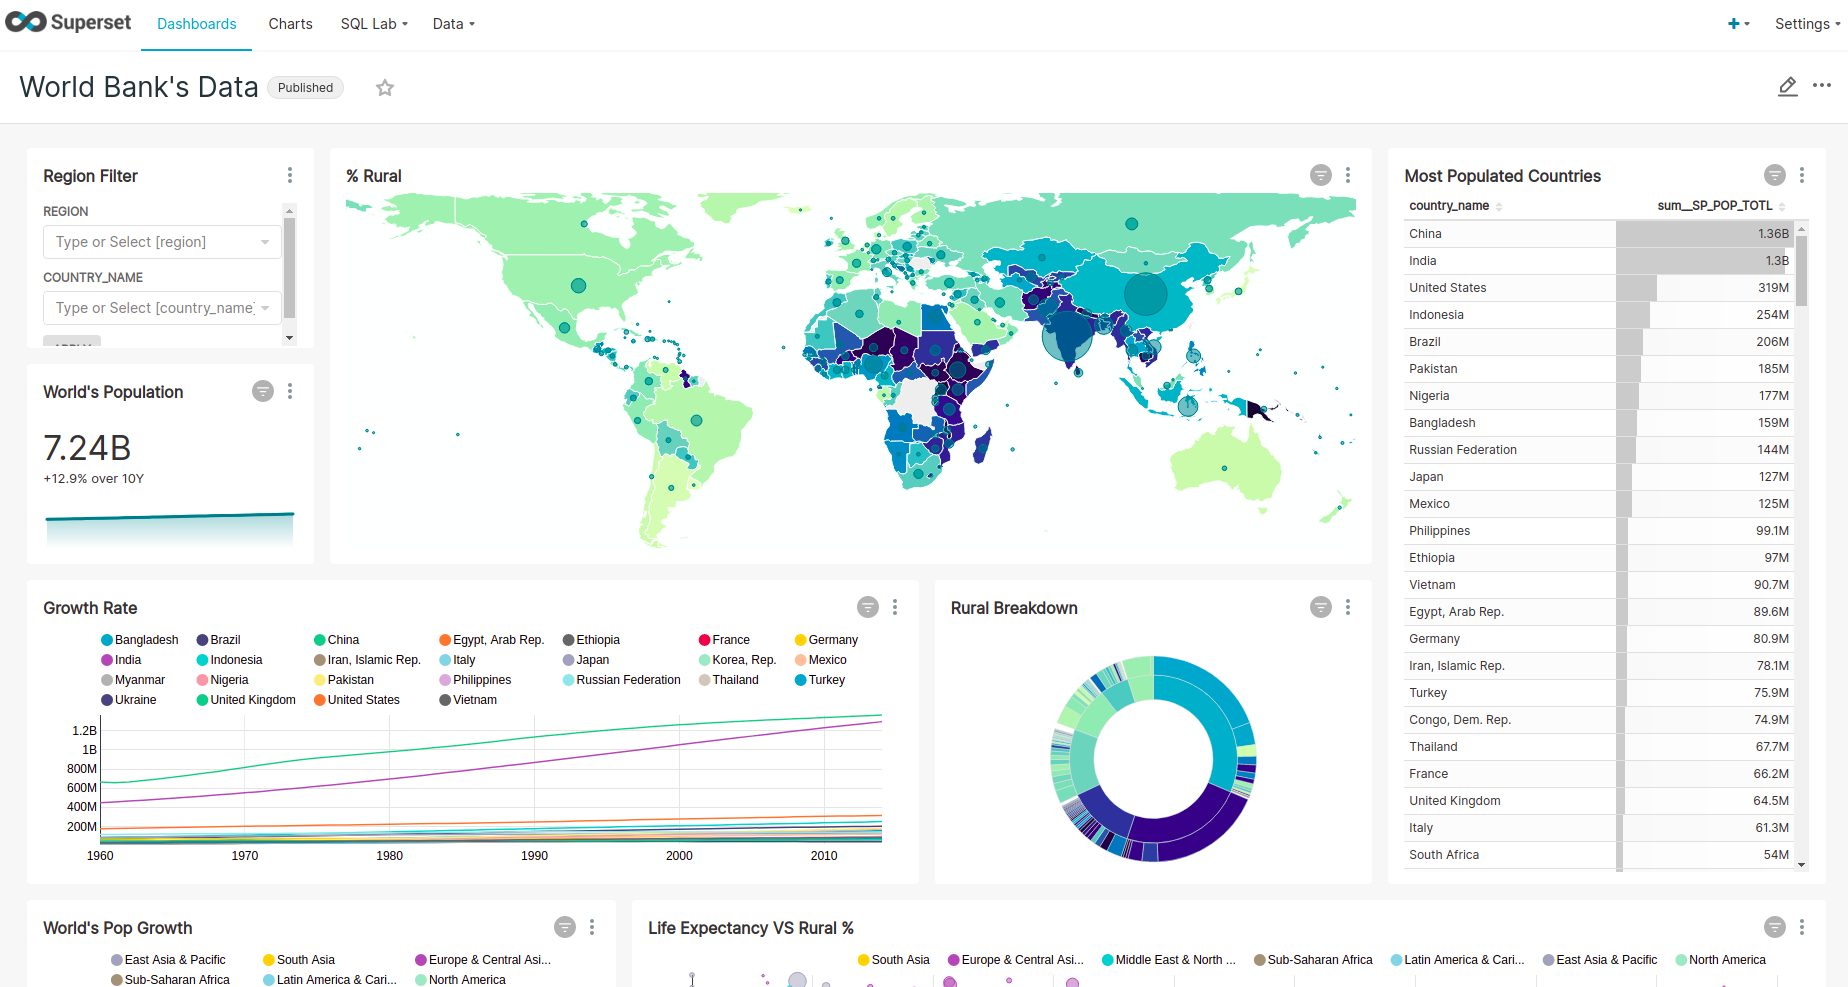
Here’s how one of the sample Dashboard looks like.
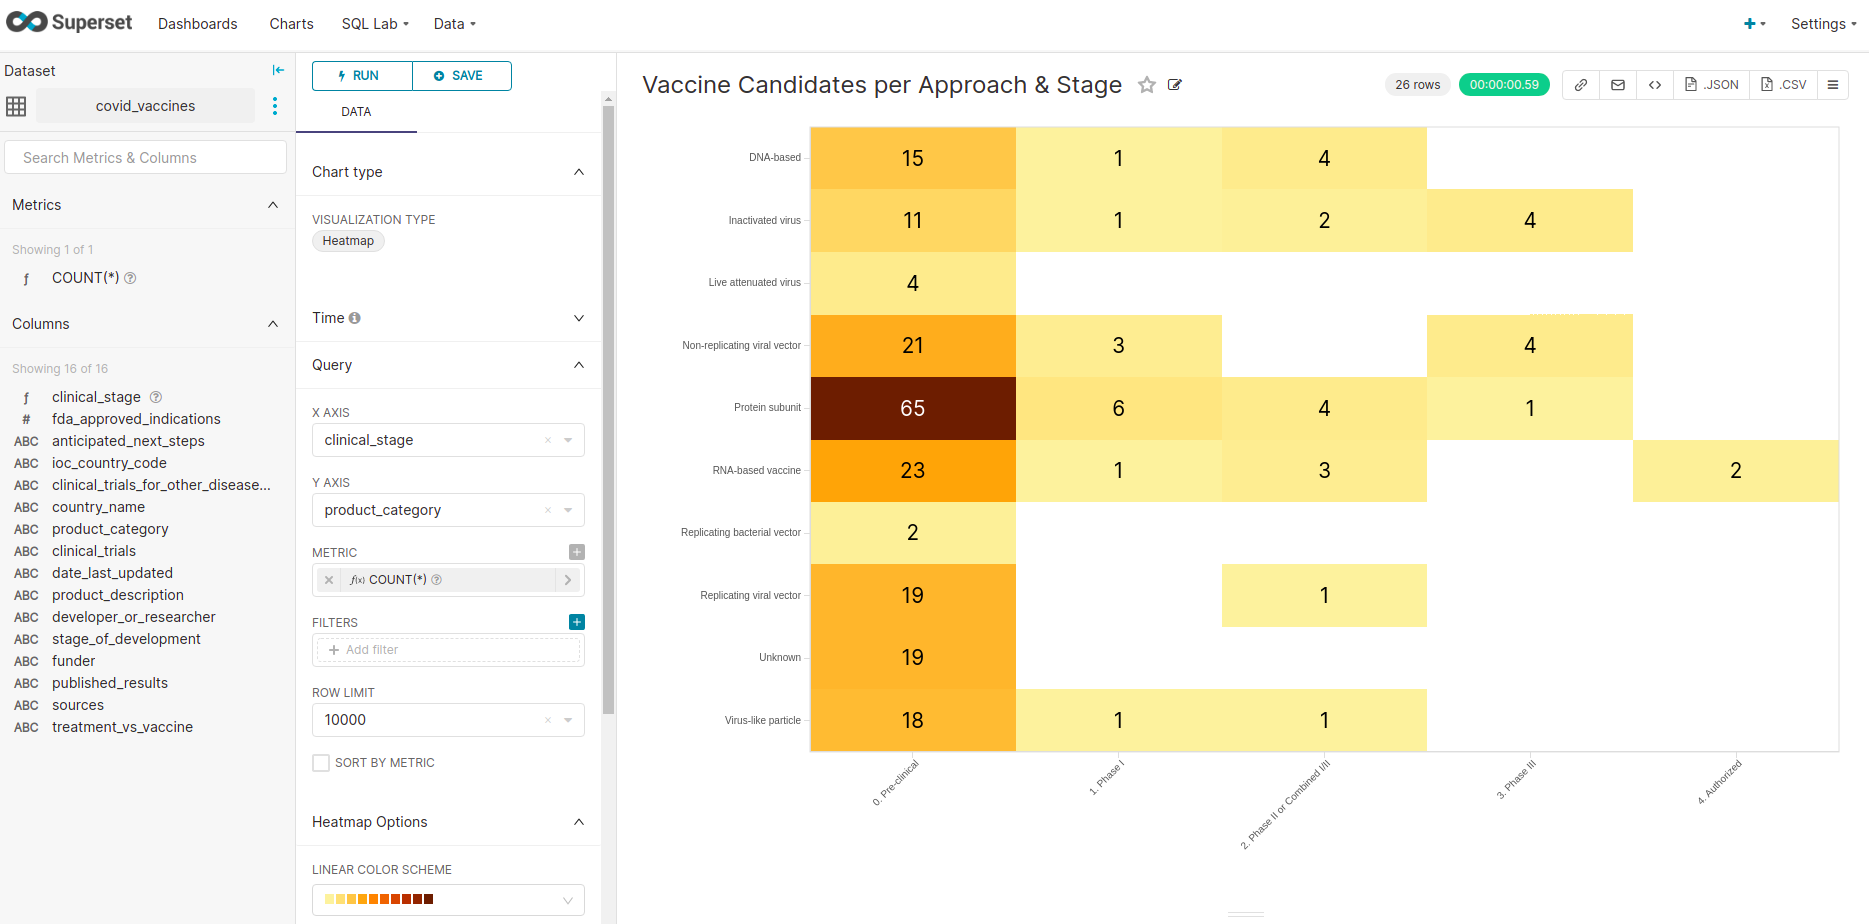
You can also create multiple types of charts like Sankey Diagram, Area Chart, Heatmap, Histogram, Timeseries Bar Chart etc. with your data.
Here’s how a sample Heatmap looks like.
If you’re looking for an open source data visualization tool, then Superset is definitely one of the best options.
So, that’s it for this article.
Thank you for reading and happy data visualizing.