InfluxDB is a time series database designed to handle high write and query loads. InfluxDB is the essential time series toolkit — dashboards, queries, tasks and agents all in one place. It is similar to Prometheus and it provides an extensive range of monitoring solution. Prometheus can be used with Grafana to create complex dashboards. InfluxDB comes with it’s own set of plugins to create dashoards.
InfluxDB empowers developers to build IoT, analytics and monitoring software. It is purpose-built to handle the massive volumes and countless sources of time-stamped data produced by sensors, applications and infrastructure
#1. Installing InfluxDB on Ubuntu
By default, InfluxDB uses the following network ports:
- TCP port
8086is available for client-server communication using the InfluxDB API. - TCP port
8088is available for the RPC service to perform back up and restore operations.
For Ubuntu users, add the InfluxData repository with the following commands:
wget -qO- https://repos.influxdata.com/influxdb.key | sudo apt-key add -
source /etc/lsb-release
echo "deb https://repos.influxdata.com/${DISTRIB_ID,,} ${DISTRIB_CODENAME} stable" | sudo tee /etc/apt/sources.list.d/influxdb.list
Then, install and start the InfluxDB service:
sudo apt-get update && sudo apt-get install influxdb
sudo service influxdb start
#2. Working with database queries
To work with the database, you need to execute the below command to access the CLI. Most of the queries for InfluxDB are similar to MySQL queries.
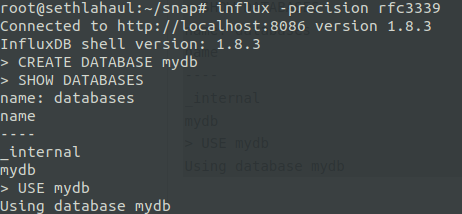
root@sethlahaul:~# influx -precision rfc3339
Connected to http://localhost:8086 version 1.8.3
InfluxDB shell version: 1.8.3
> CREATE DATABASE mydb
>
> SHOW DATABASES
name: databases
name
----
_internal
mydb
>
> USE mydb
Using database mydb
>
You can also run SELECT and INSERT queries on InfluxDB. Below are few queries for example.
> INSERT cpu,host=serverA,region=us_west value=0.64
>
> SELECT "host", "region", "value" FROM "cpu"
name: cpu
time                           host    region  value
----                           ----    ------  -----
2020-12-01T18:00:17.687186632Z serverA us_west 0.64
>
> INSERT temperature,machine=unit42,type=assembly external=25,internal=37
>
> SELECT * FROM "cpu"
name: cpu
time                           host    region  value
----                           ----    ------  -----
2020-12-01T18:00:17.687186632Z serverA us_west 0.64
>
> SELECT * FROM temperature"
name: temperature
time                           external internal machine type
----                           -------- -------- ------- ----
2020-12-01T18:00:52.356593582Z 25       37       unit42  assembly
>
#3. Create Dashboards using Chronograf
Chronograf is InfluxData’s open source web application. Use Chronograf with the other components of the TICK stack to visualize your monitoring data and easily create alerting and automation rules.
Key features :
Infrastructure monitoring –
- View all hosts and their statuses in your infrastructure
- View the configured applications on each host
- Monitor your applications with Chronograf’s pre-created dashboards
Alert management –
Chronograf offers a UI for Kapacitor, InfluxData’s data processing framework for creating alerts, running ETL jobs, and detecting anomalies in your data.
- Generate threshold, relative, and deadman alerts on your data
- Easily enable and disable existing alert rules
- View all active alerts on an alert dashboard
- Send alerts to the supported event handlers, including Slack, PagerDuty, HipChat, and more
Data visualization –
- Monitor your application data with Chronograf’s pre-created dashboards
- Create your own customized dashboards complete with various graph types and template variables
- Investigate your data with Chronograf’s data explorer and query templates
Database management –
- Create and delete databases and retention policies
- View currently-running queries and stop inefficient queries from overloading your system
- Create, delete, and assign permissions to users (Chronograf supports InfluxDB OSS and InfluxEnterprise user management)
To install and run Chronograf, run the below commands.
wget https://dl.influxdata.com/chronograf/releases/chronograf_nightly_amd64.deb
sudo dpkg -i chronograf_nightly_amd64.deb
chronograf
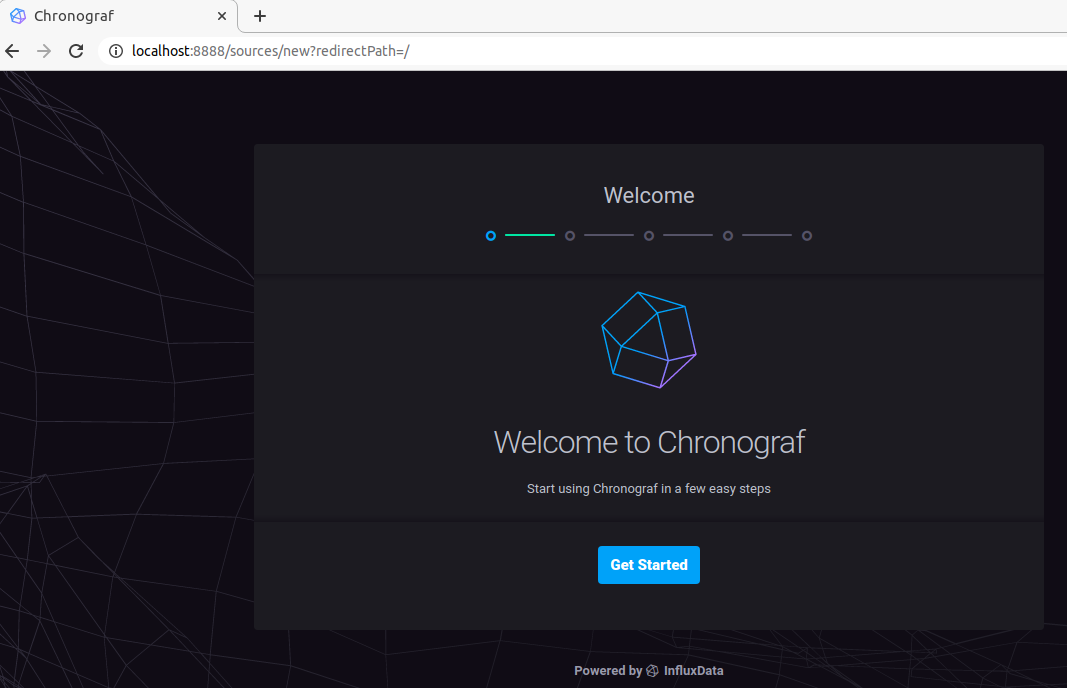
Once Chronograf service starts running, go to http://localhost:8888.
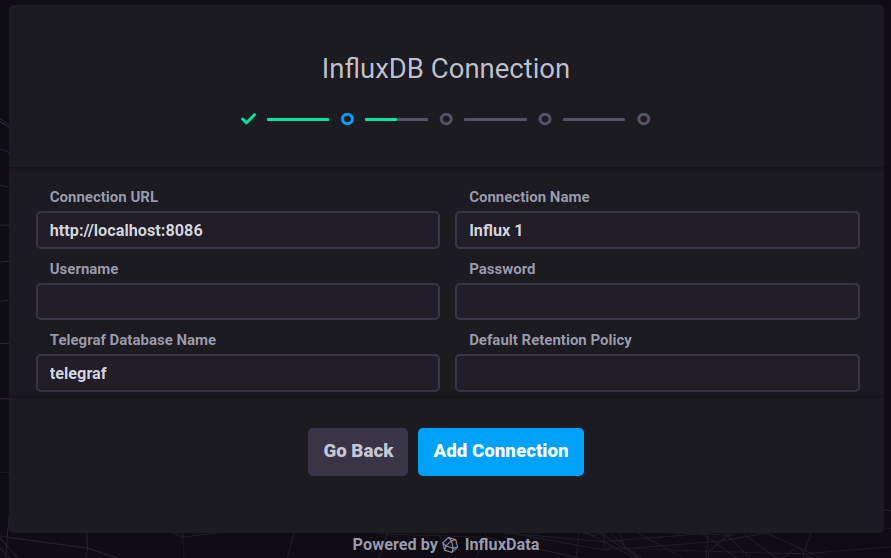
#4. Chronograf Configuration
To configure dashboards on Chronograf, you need to add the InfluxDB as a source.
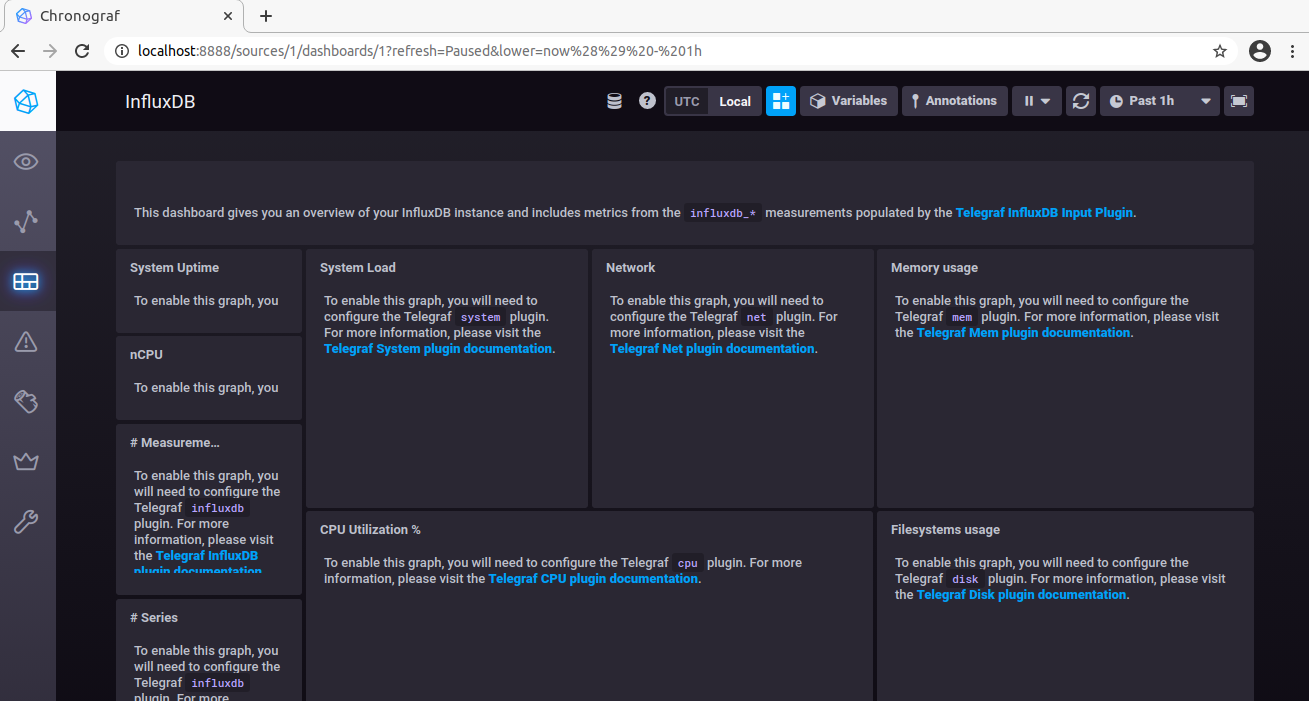
Once the above configuration is done. You will be able to explore Chronograf and create dashboards as per your requirement.
The next post will be about the InfluxDB Telegraf plugin which offers an extensive monitoring solution. So, stay tuned for more.