Telegraf is a plugin-driven server agent for collecting & reporting metrics, and is the first piece of the TICK stack. Telegraf has plugins to source a variety of metrics directly from the system it’s running on, pull metrics from third party APIs, or even listen for metrics via a statsd and Kafka consumer services. It also has output plugins to send metrics to a variety of other datastores, services, and message queues, including InfluxDB, Graphite, OpenTSDB, Datadog, Librato, Kafka, MQTT, NSQ, and many others.
Key features :
Here are some of the features that Telegraf currently supports that make it a great choice for metrics collection.
- Written entirely in Go. It compiles into a single binary with no external dependencies.
- Minimal memory footprint.
- Plugin system allows new inputs and outputs to be easily added.
- A wide number of plugins for many popular services already exist for well known services and APIs.
#1. Install Telegraf
wget -qO- https://repos.influxdata.com/influxdb.key | sudo apt-key add -
source /etc/lsb-release
echo "deb https://repos.influxdata.com/${DISTRIB_ID,,} ${DISTRIB_CODENAME} stable" | sudo tee /etc/apt/sources.list.d/influxdb.list
The next step that you can execute is install and start the telegraf service.
sudo apt-get update && sudo apt-get install telegraf
sudo service telegraf start
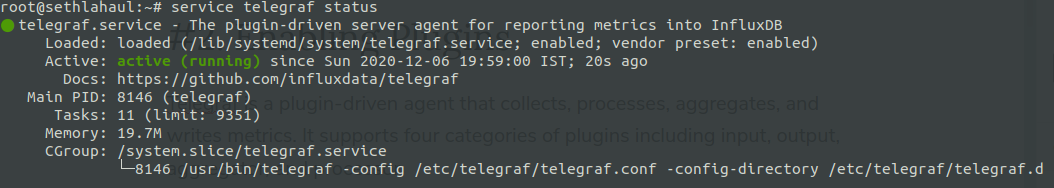
To check if telegraf service is running, you can run the below command.
sudo service telegraf status
You should see the below if it’s running.
#2. Configuring Dashboards
Telegraf is a plugin-driven agent that collects, processes, aggregates, and writes metrics. It supports four categories of plugins including input, output, aggregator, and processor.
Telegraf has an extensive set of plugins to monitor just about any application or OS metrics.
Below is a simple dashboard which you can create within a few minutes.
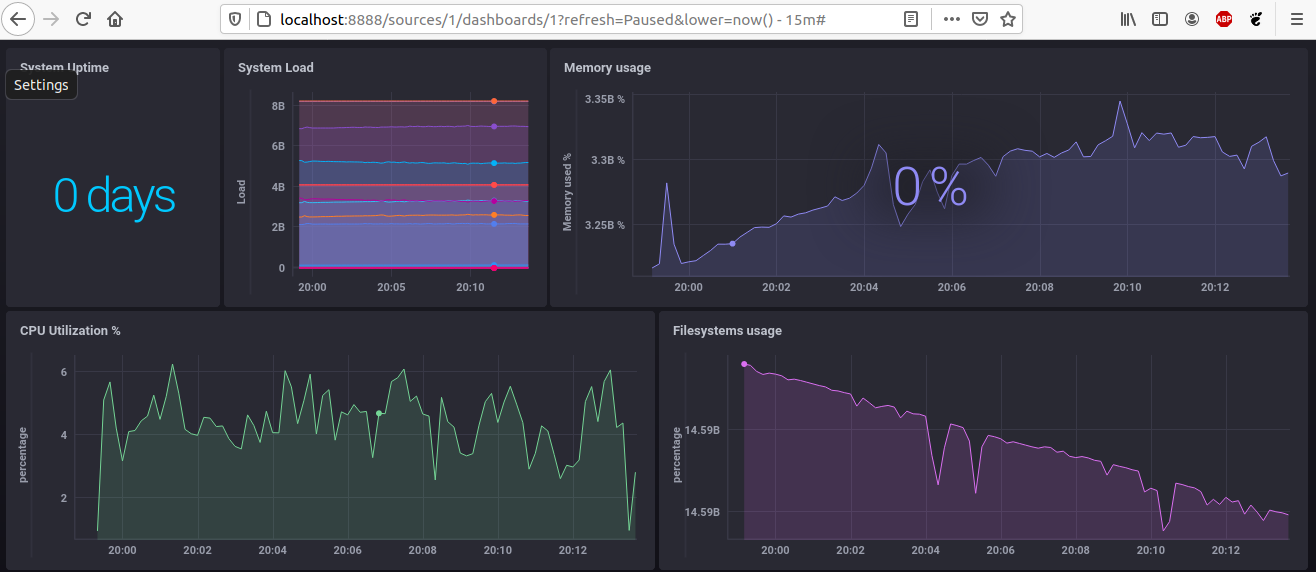
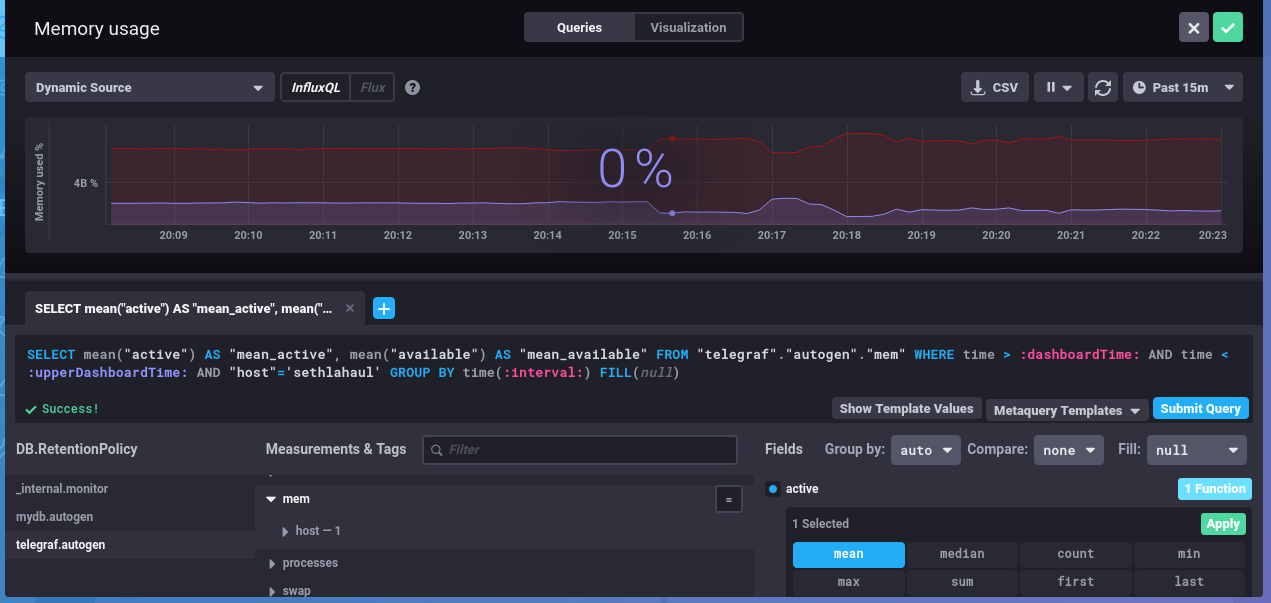
You can configure each of the dashboards by choosing each of the parameter that you want Telegraf to display the data for.
For example, if you would like to see the active memory being used you can select the below configuration from mem.
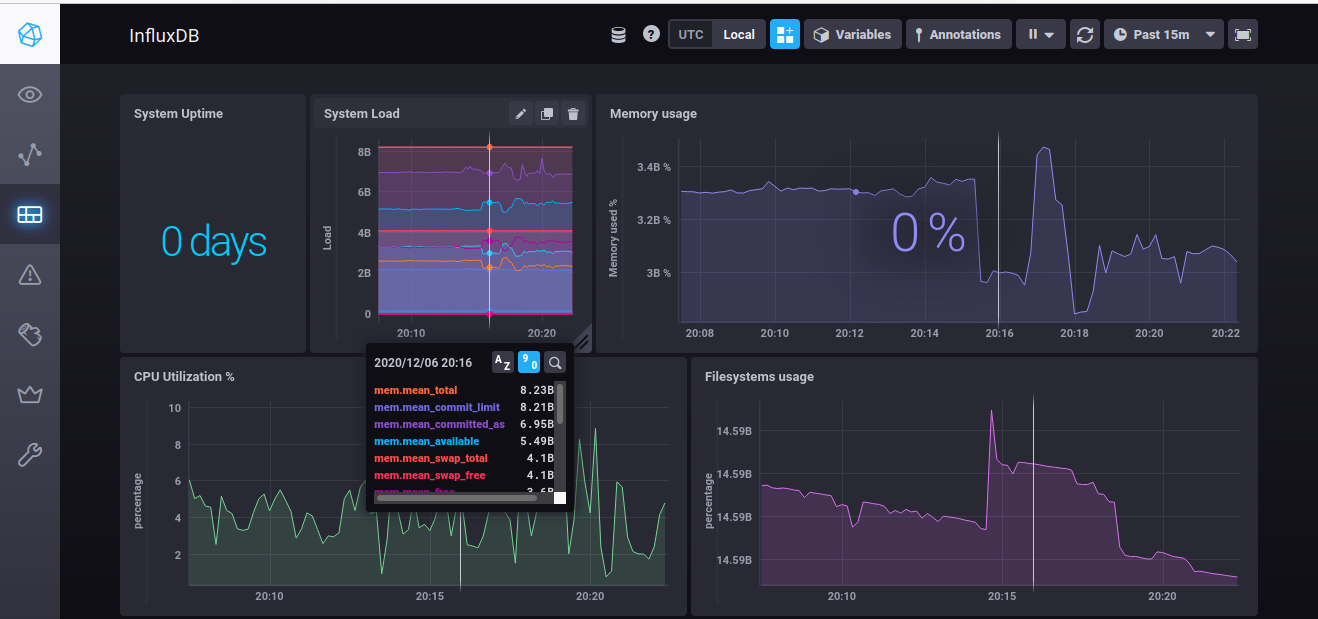
The dashboards are visually appealing and you can explore individual data in the graph for specific timestamps when you hover over them.
So, that’s it for this tutorial. Stay tuned for more.