Grafana is a multi-platform open source analytics and interactive visualization web application. It provides charts, graphs, and alerts for the web when connected to supported data sources. It is expandable through a plug-in system. End users can create complex monitoring dashboards using interactive query builders.
Grafana works best for time series databases like Prometheus, Graphite, OpenTSDB, InfluxDB etc. It also works for traditional databases like MySQL, PostgreSQL and SQL Server. For this post, I have used MySQL.
#1. Download Grafana
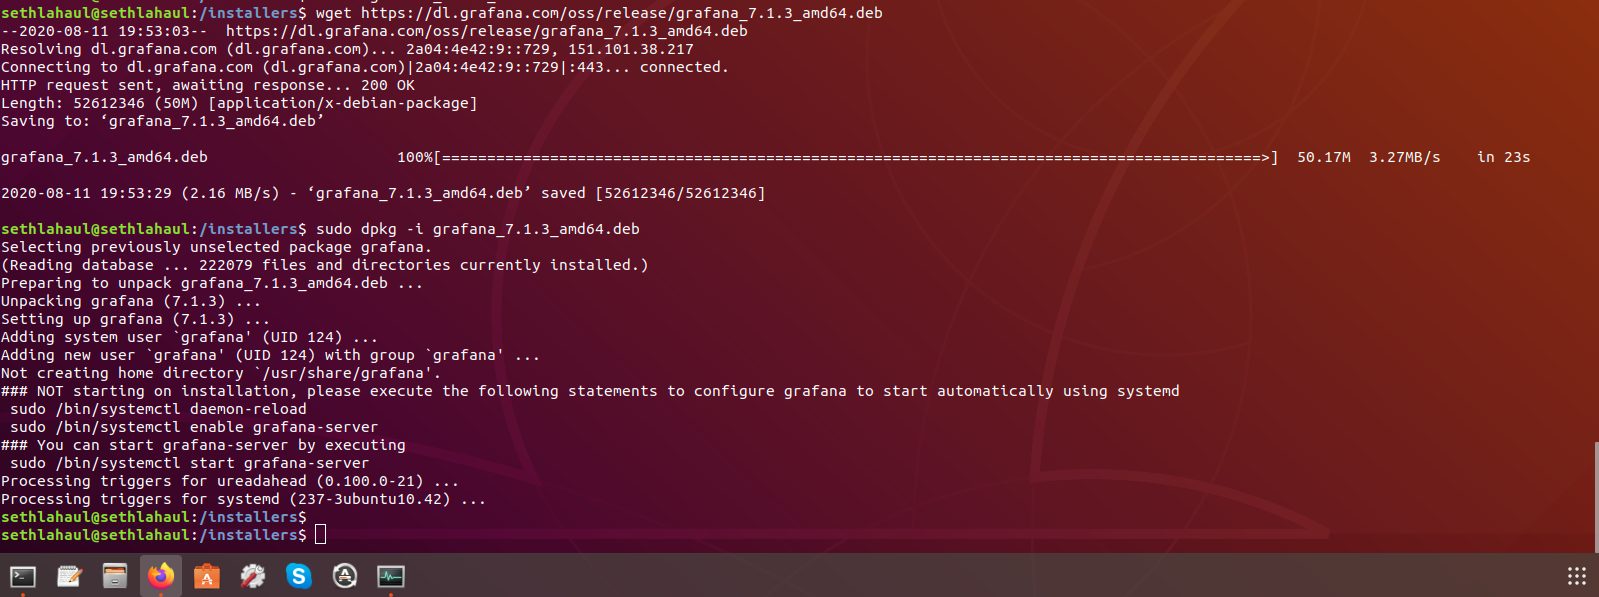
The first thing that you need to do is download Grafana. It can be installed on Linux, Windows, Mac, Docker etc. You can check the download page for instructions on how to install Grafana.
sudo apt-get install -y adduser libfontconfig1
wget https://dl.grafana.com/oss/release/grafana_7.1.3_amd64.deb
sudo dpkg -i grafana_7.1.3_amd64.deb
#2. Run Grafana
Once the package has been installed, you can run Grafana. If you have used the debian file, you can just start the process as a service.
sudo service grafana-server start
sudo service grafana-server start
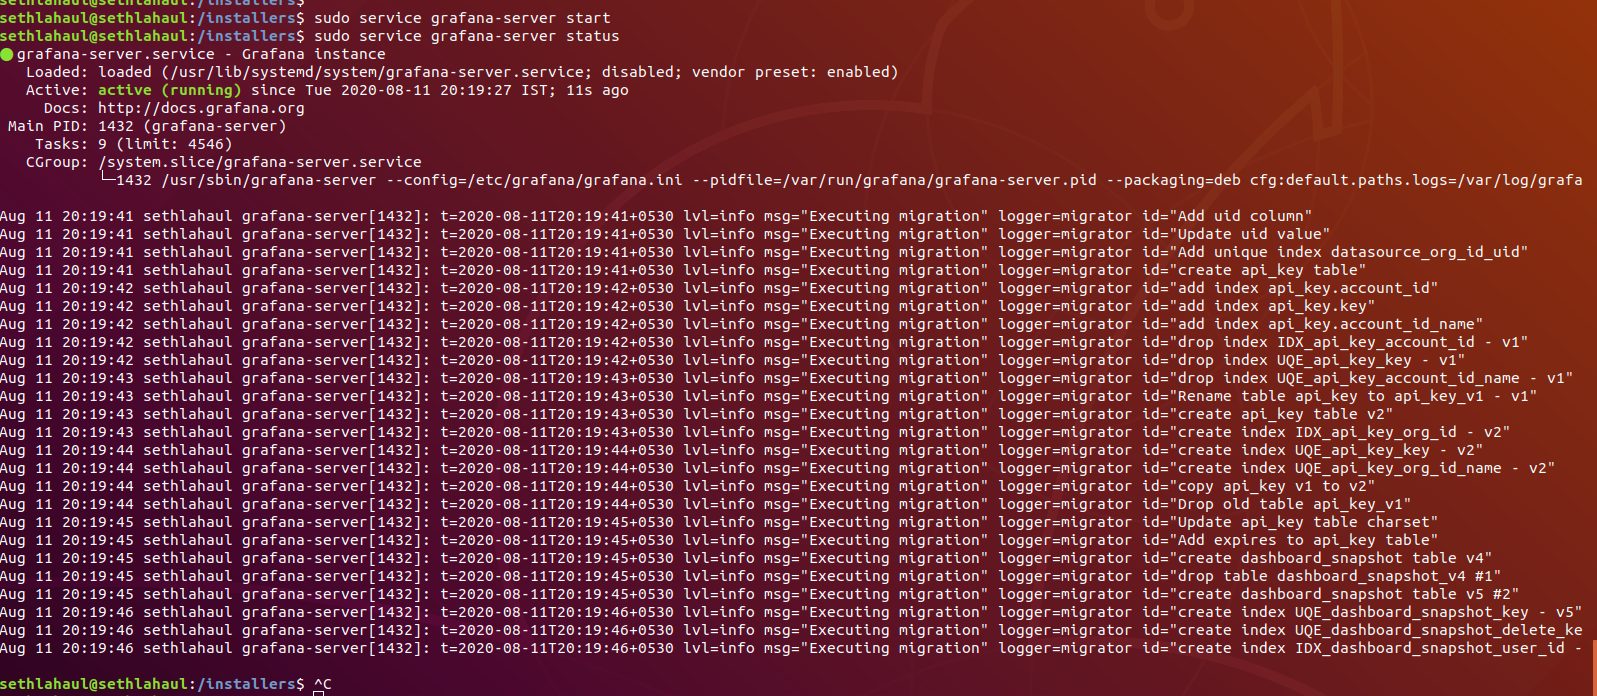
Once Grafana service has been started, you can go to browser and open the console. By default, it runs on port 3000 – http://localhost:3000.
#3. Add Data Source
The first thing that you need to do is add a data source. For this post, I installed MySQL on Ubuntu. Once MySQL is installed, add the data source.
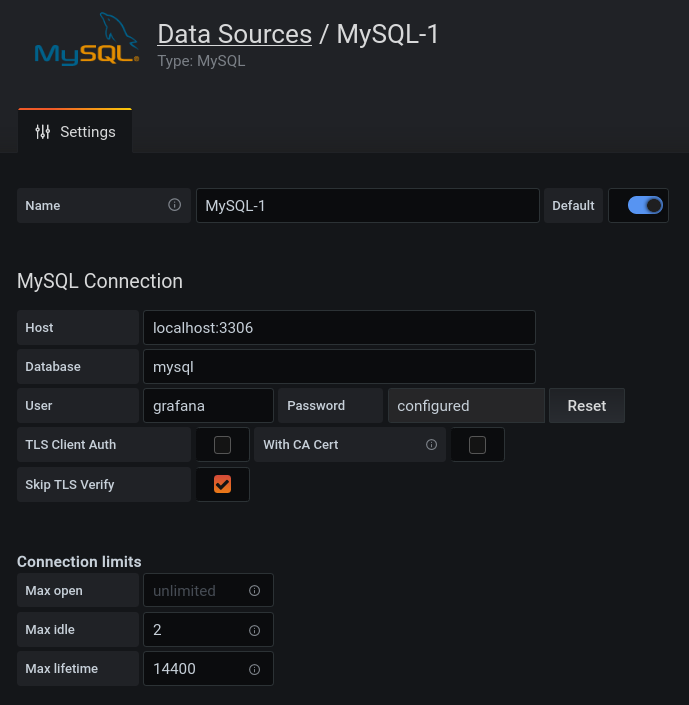
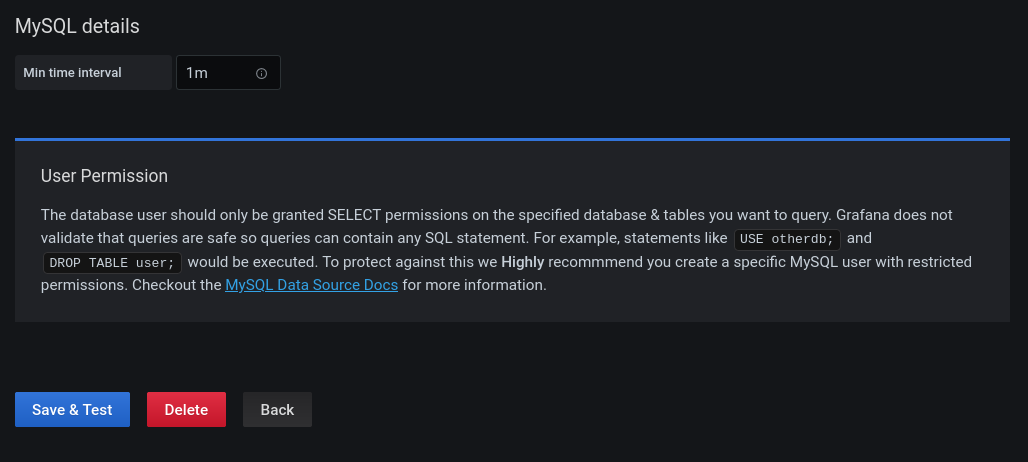
Also, make sure you create a separate user in MySQL and grant only SELECT privileges. This prevents any DROP or DELETE commands to remove your data.
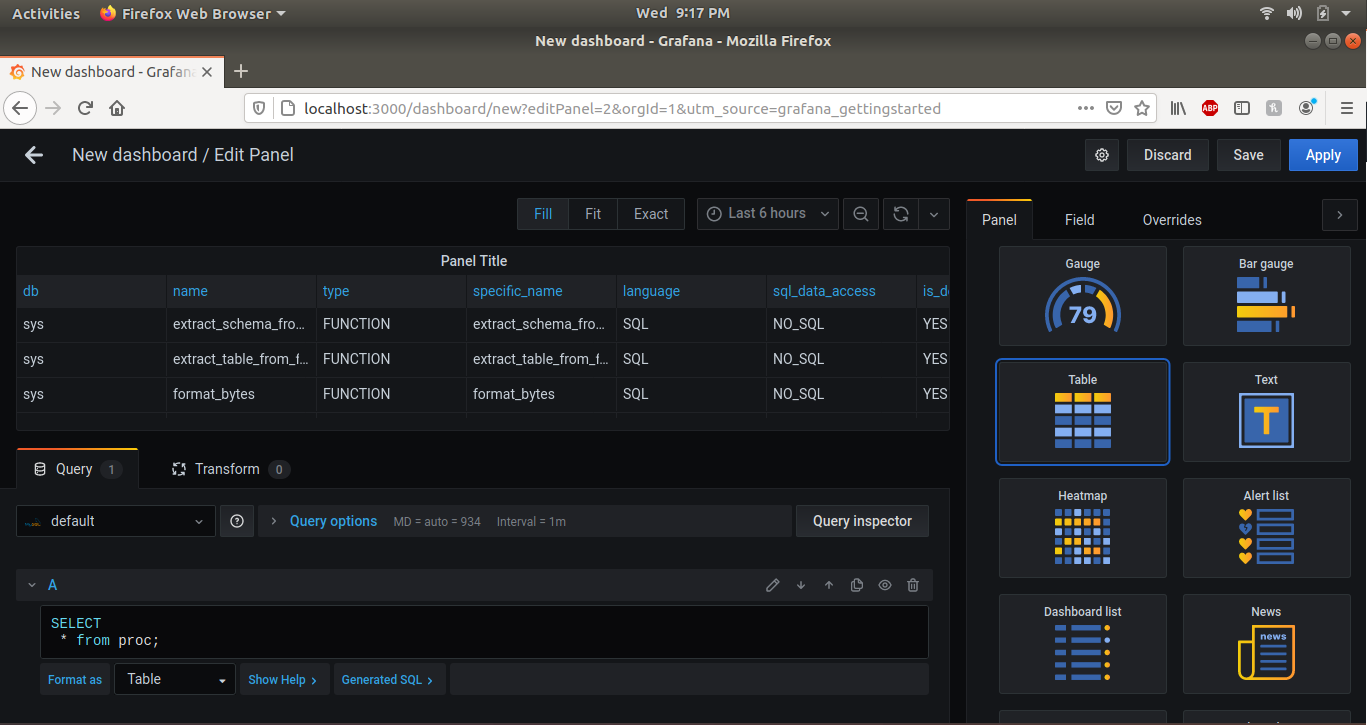
#4. Create Dashboards
Once Grafana is up and running. You can create your own dashboards depending on the presentation of data. For time series databases, you can create time series graphs. I used one of the default tables in MySQL. So, it will look something like below.
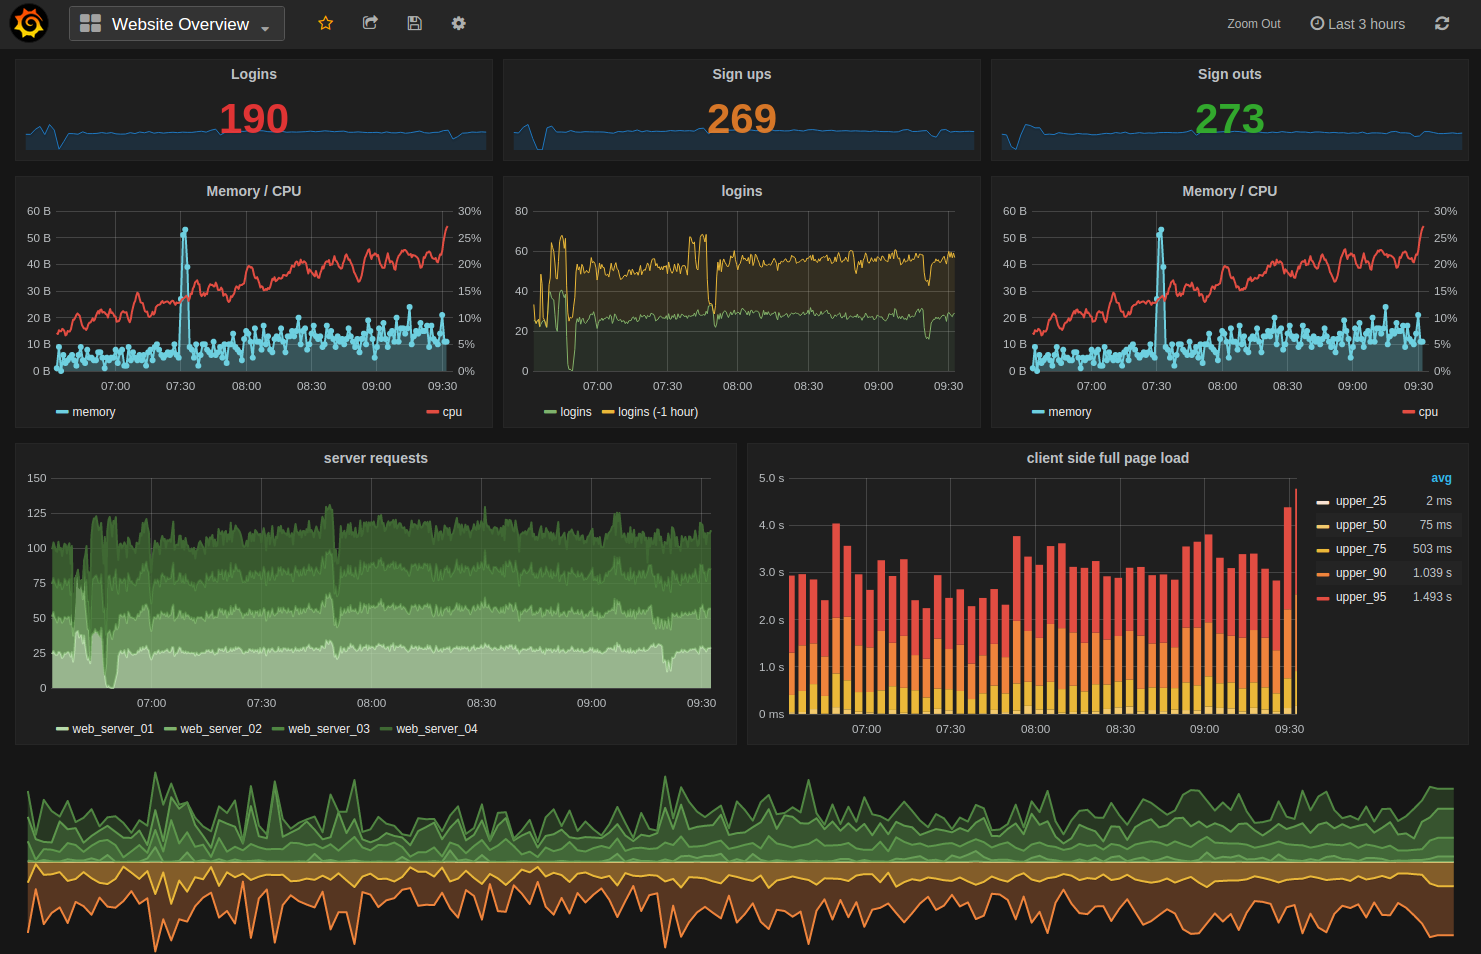
#5. Creating Complex Dashboards For Time Series Databases
If you have a time series databases, you can create complex dashboards for visualization of metrics data. You can have data for multiple databases within a single dashboard which will look something like below.