To monitor Kafka using ELK Stack, the first thing that you need to do is install Elasticsearch and Kibana.
After that, install Metricbeat using the below steps.
Download MetricBeat :
curl -L -O https://artifacts.elastic.co/downloads/beats/metricbeat/metricbeat-7.9.2-amd64.deb
sudo dpkg -i metricbeat-7.9.2-amd64.deb
Modify /etc/metricbeat/metricbeat.yml. Make sure to add the Elasticsearch and Kibana addresses.
# ---------------------------- Elasticsearch Output ----------------------------
output.elasticsearch:
  # Array of hosts to connect to.
  hosts: ["localhost:9200"]

# Starting with Beats version 6.0.0, the dashboards are loaded via the Kibana API.
# This requires a Kibana endpoint configuration.
setup.kibana:

  # Kibana Host
  # Scheme and port can be left out and will be set to the default (http and 5601)
  # In case you specify and additional path, the scheme is required: http://localhost:5601/path
  # IPv6 addresses should always be defined as: https://[2001:db8::1]:5601
  host: "localhost:5601"
Enable and configure the kafka module.
sudo metricbeat modules enable kafka
Modify the settings in the /etc/metricbeat/modules.d/kafka.yml file.
# Kafka metrics collected using the Kafka protocol
- module: kafka
  #metricsets:
  #  - partition
  #  - consumergroup
  period: 10s
  hosts: ["localhost:9092"]
Start Metricbeat – The setup command loads the Kibana dashboards. If the dashboards are already set up, omit this command.
sudo metricbeat setup
sudo service metricbeat start
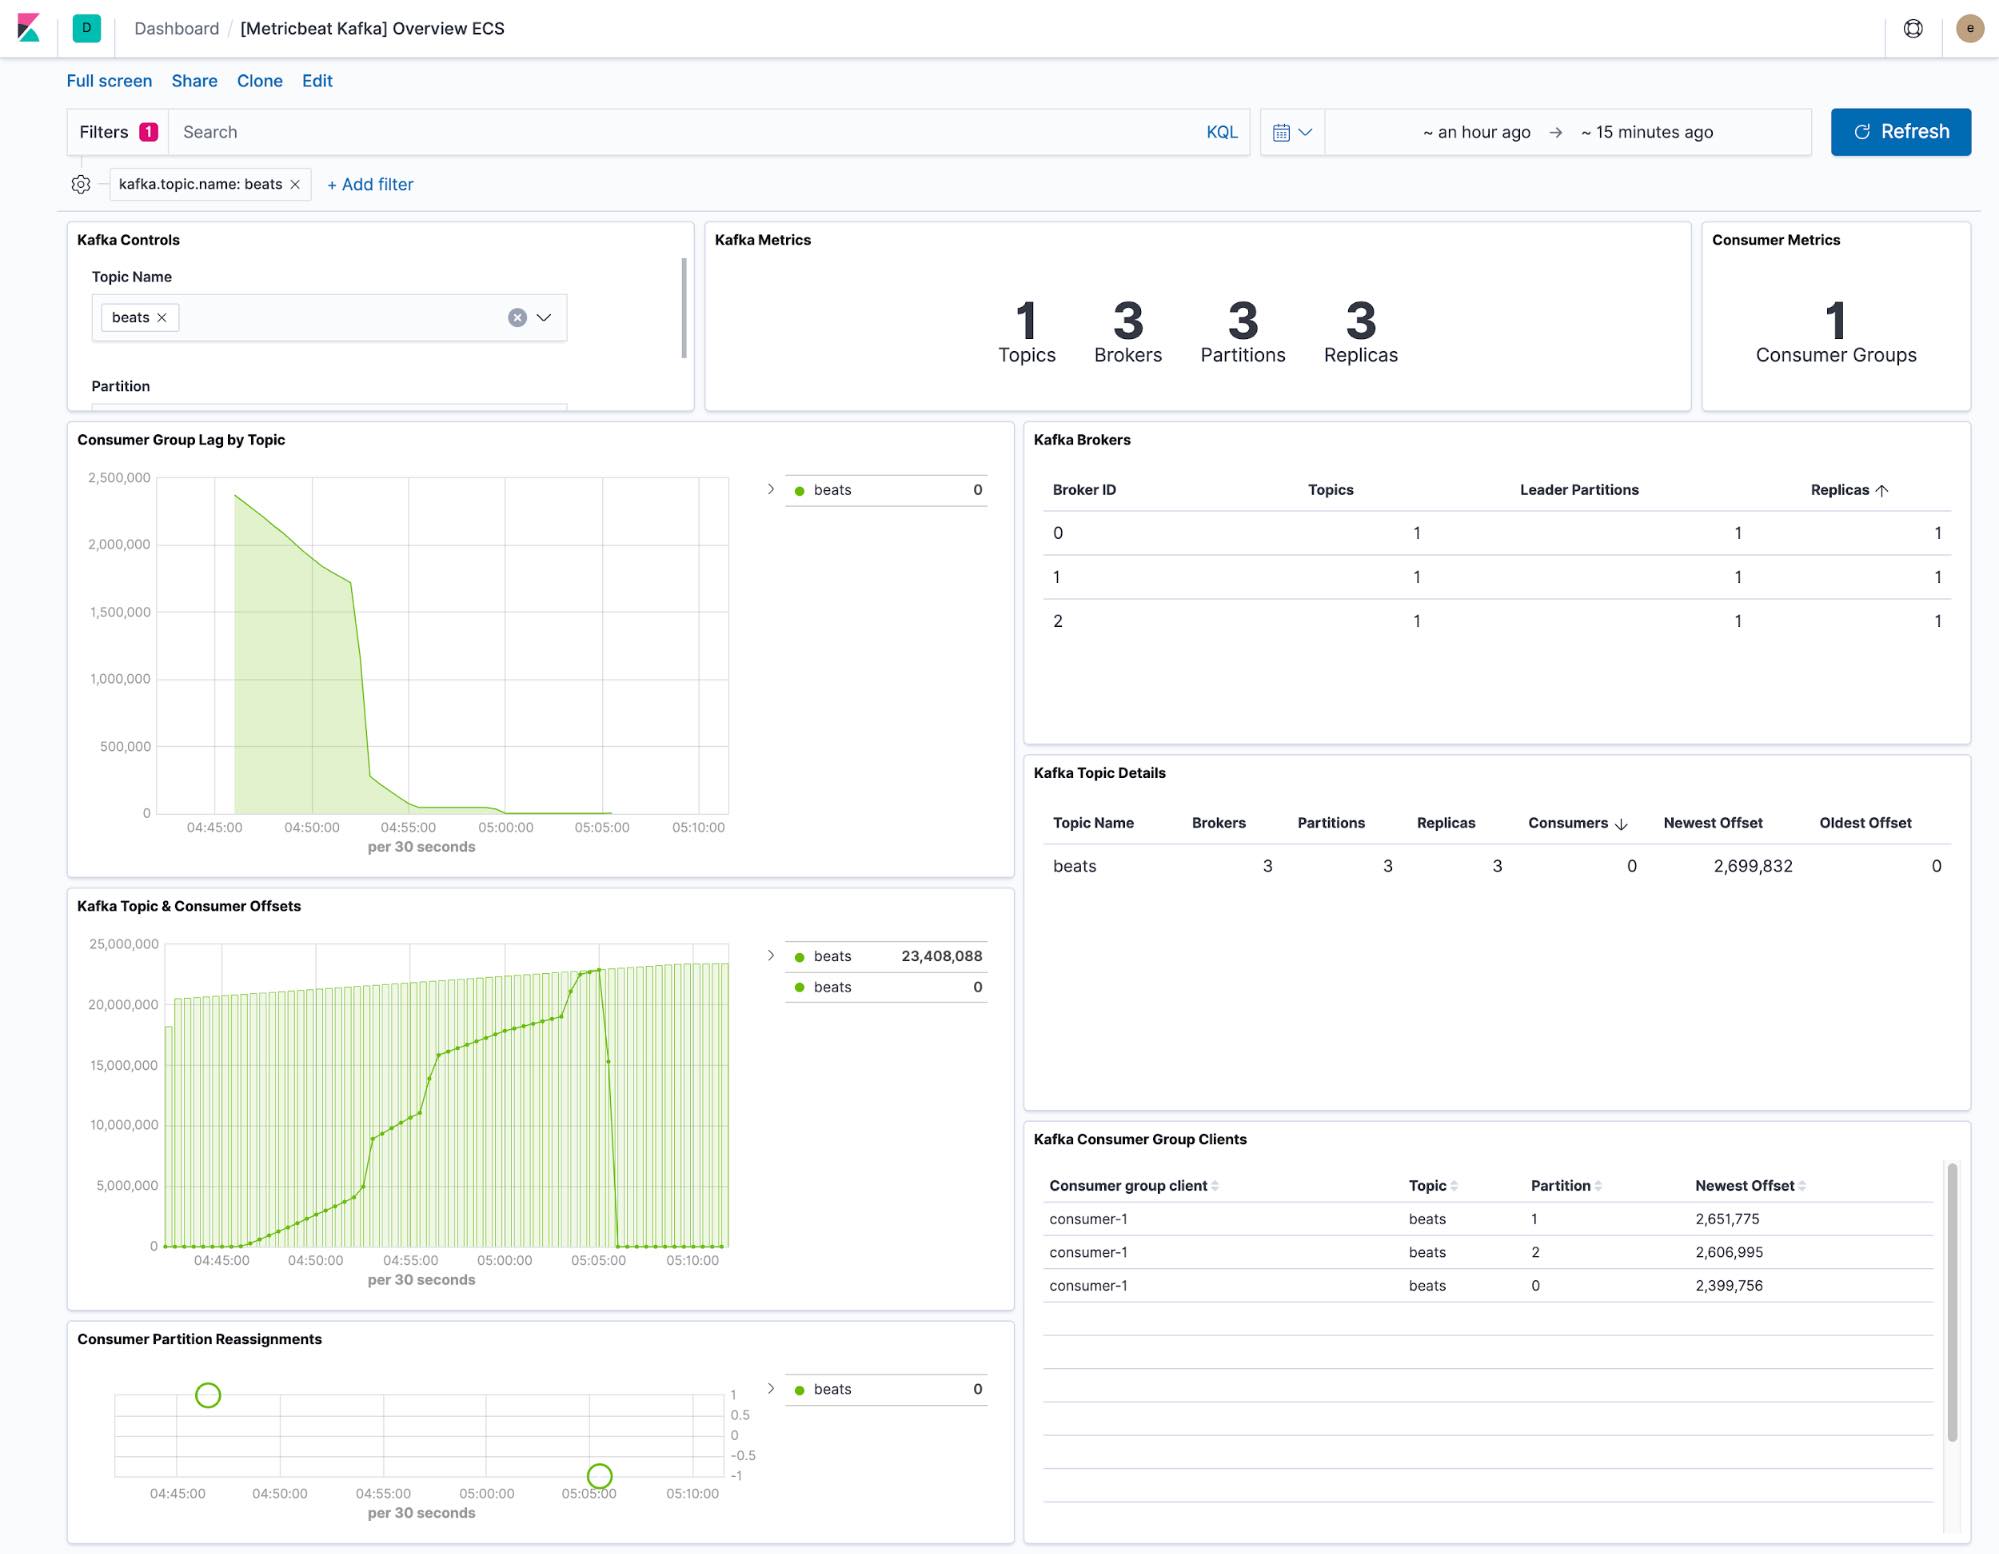
Once the configuration is complete, you should see a dashboard like below depending on your Kafka setup.