Charts are an integral part of web development if you’re looking to create a data driven website. Charts provide an easier representation of data. After the release of HTML5 with canvas, drawing charts have become much easier. Here’s 5 best open source JavaScript Charts libraries.
1. Chart.js
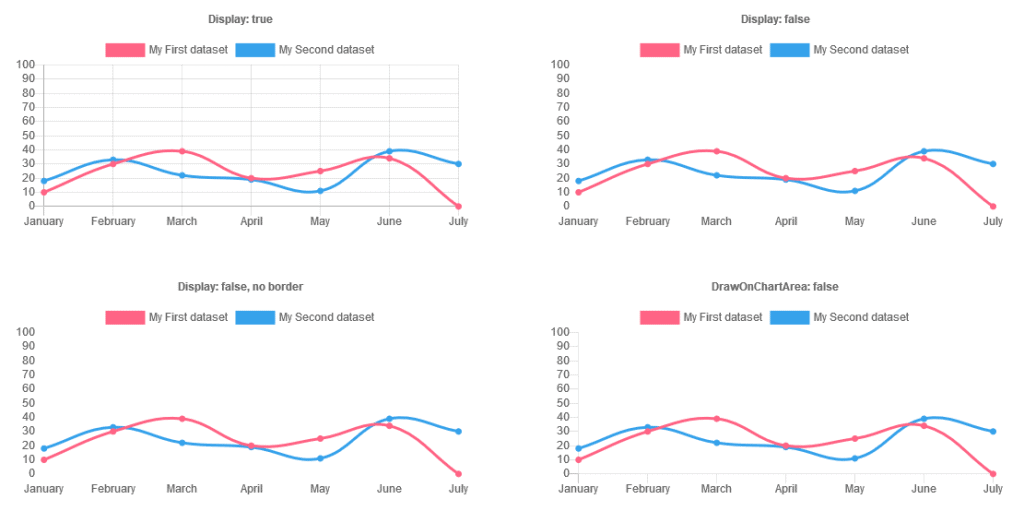
Chart.js is distributed under the MIT License and is one of the best open source libraries for creating charts. Using the canvas tag in HTML5, it’s pretty easy to draw a chart.

Chart.js is delivered using jsDelivr which is a CDN in itself and therefore doesn’t impact the load time of your pages to a high degree.
<script src="https://cdn.jsdelivr.net/npm/chart.js@2/dist/Chart.min.js"></script>
You can draw any kinds of charts with Chart.js including Bar Charts, Line Charts, Area Charts, Scales etc.
2. ApexCharts.js
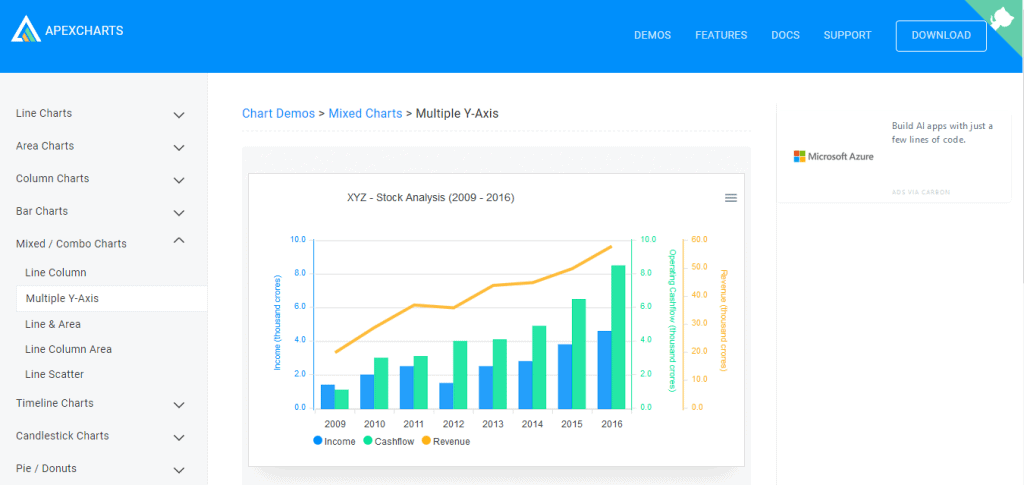
ApexCharts has partnered with FusionCharts to bring a wider range of data visualization components. ApexCharts provides responsive, interactive, dynamic and high performance charts.
Like Chart.js, it provides a whole range of charts.
ApexCharts can be download using npm or it can directly integrated into HTML via jsDelivr.
<script src="https://cdn.jsdelivr.net/npm/apexcharts"></script>
3. Google Charts
Google Charts comes with a lot of customization. It also lets you connect multiple charts and create a dashboard. Google Charts are rendered using HTML5/SVG to provide cross-browser compatibility and cross platform portability to iPhones, iPads and Android.

It also lets you send a query to a data source that supports the Chart Tools Datasource protocol which would let you show dynamic data into your chart.
4. CanvasJS
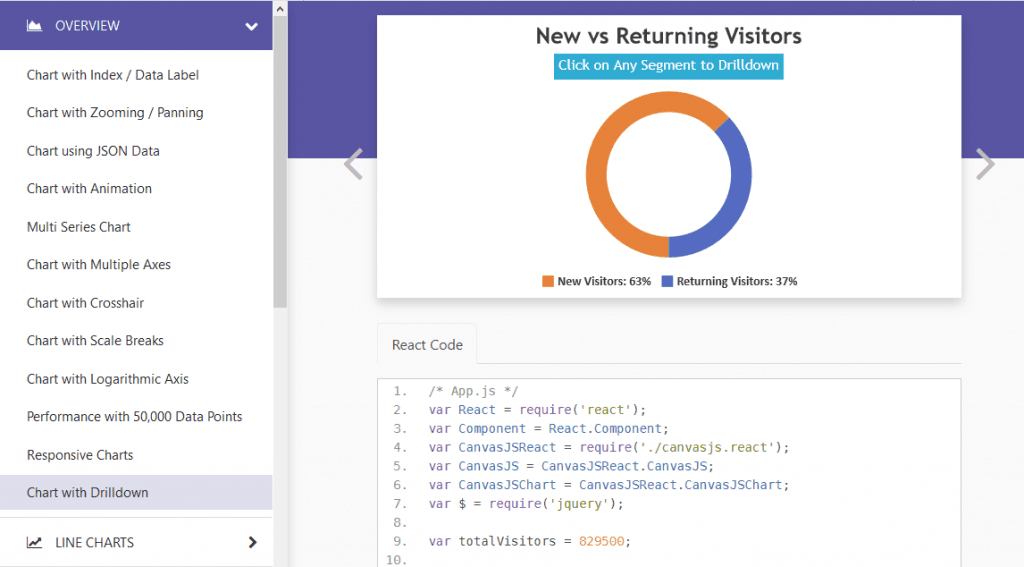
CanvasJS is one of the most popular JS library out there for charts. It’s more or less used by most major companies around the work for visualizing data.

CanvasJS provides both individual charts and integrated dashboards. Charts are available for ASP.NET MVC, PHP, JSP, Spring MVC, JavaScript, jQuery, Angular and React.
5. Chartworks
Chartworks provides fully responsive HTML5 charts which looks great on any device. It also supports fluid panning and zooming of all chart data.
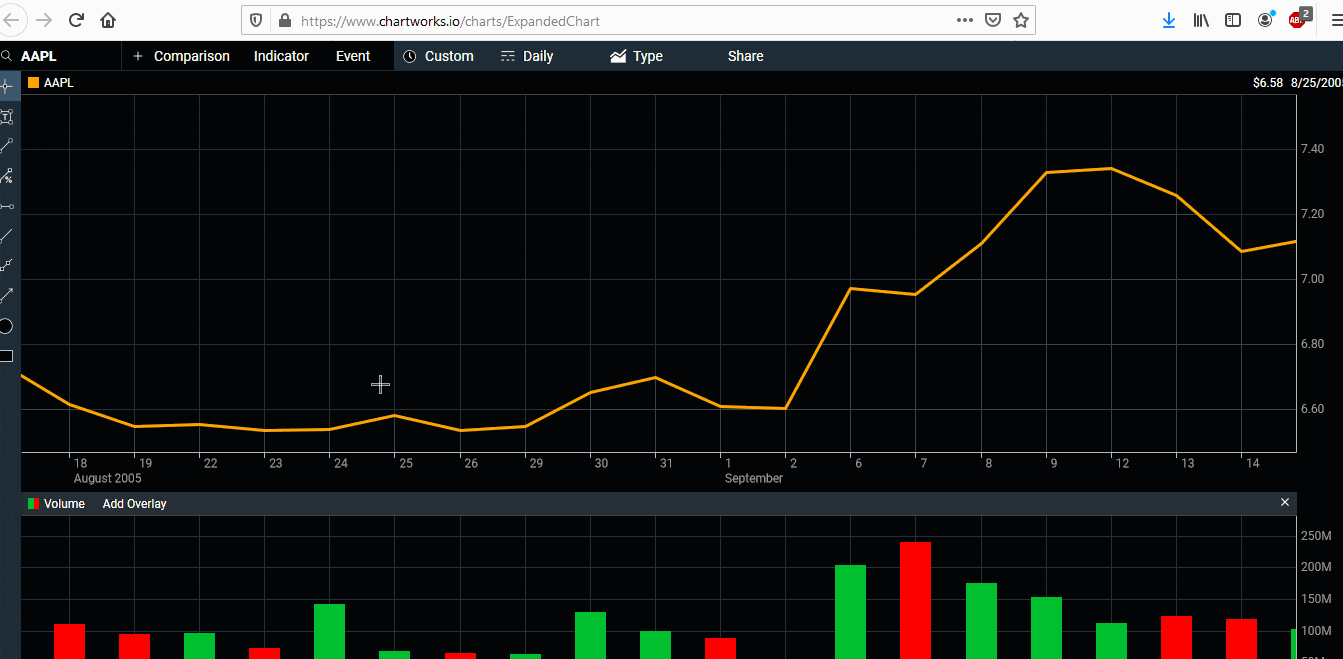
Chartworks also provides iOS and Android SDK. You can style the appearance of the advanced charts to match the theme of yours apps.
Conclusion
Charts are a great way to visualize data. Used any other JavaScript Charts Libraries ? Share your views in the comment section below.